- Популярные видео
- Авто
- Видео-блоги
- ДТП, аварии
- Для маленьких
- Еда, напитки
- Животные
- Закон и право
- Знаменитости
- Игры
- Искусство
- Комедии
- Красота, мода
- Кулинария, рецепты
- Люди
- Мото
- Музыка
- Мультфильмы
- Наука, технологии
- Новости
- Образование
- Политика
- Праздники
- Приколы
- Природа
- Происшествия
- Путешествия
- Развлечения
- Ржач
- Семья
- Сериалы
- Спорт
- Стиль жизни
- ТВ передачи
- Танцы
- Технологии
- Товары
- Ужасы
- Фильмы
- Шоу-бизнес
- Юмор
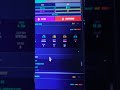
Mapping 2 Million Lines of Go: The Architecture of Kubernetes in 3D
How do you visualize the structural mechanics of planetary-scale cloud infrastructure?
In this demo, we deploy the GitGalaxy 3D Visualizer to audit the Kubernetes repository. Bypassing the compiler bottlenecks and context-window limitations of traditional ASTs and LLMs, our blAST engine processed nearly 2 million lines of active execution logic (predominantly Go and YAML) in just 44.75 seconds.
The result is a deterministic, function-level knowledge graph. Rather than rendering subjective code quality scores, this visualization exposes the exact physical mechanics, network topology, and Risk Exposures of the Kubernetes ecosystem:
🌐 Macro-Network Topology (The Spaghetti Monolith): Despite its microservice-oriented purpose, the Kubernetes repository itself exhibits a Modularity score of 0.0 and a negative Assortativity (-0.3704). Visually, this manifests as a highly coupled monolith with fragile single-points-of-failure rather than clean internal micro-boundaries. Which makes sense that it is a repo of many different service types for many different ecosystems that by definition cannot be tightly clustered.
🏗️ Foundational Load-Bearers & Blind Bottlenecks: By calculating gravitational pull based on inbound imports, we can visually isolate the core pillars of the system. Files like context.go (1,964 inbound connections) and time.go (1,384 inbound) anchor the entire ecosystem. Furthermore, we identify "Blind Bottlenecks"—massive nodes like testing.go that have an extreme blast radius but suffer from a 66% Documentation Risk exposure, meaning developers modifying them are flying blind.
🌪️ The Hotspot Matrix & Cumulative Risk:
We use dynamic color overlays to highlight multi-dimensional technical debt. The visualization pinpoints files with extreme Cumulative Risk, such as upgradeaware_test.go and genericapiserver_test.go, which are heavily burdened by high injection surface exposure, logic bombs, and spec match risks.
⚙️ Algorithmic Density & I/O Latency: The engine isolates computationally expensive execution paths. Interestingly, the highest time complexity (recursive O(2^N)) and database gravity aren't always in the Go code, but heavily concentrated in deployment shell scripts like kube_codegen.sh, util.sh (3,231 DB Complexity), and configure-helper.sh.
👤 Silo Risk (Key-Person Dependencies): The visualizer exposes severe 'Bus Factor' risks by cross-referencing Git ownership with structural mass. We can visually isolate massive, structurally critical hubs—like validation_test.go (Mass: 6228.34)—that are maintained with 100% isolated ownership by a single developer.
🛡️ Security Posture: While the GitGalaxy XGBoost ML inference model confirmed a clean bill of health with zero malicious structural DNA (malware/trojans) detected in the core logic, the ecosystem audit did flag 73 binary anomalies (high entropy/packed payloads) via the X-Ray lens that require verification.
By rendering files as stars and dependencies as gravitational forces, GitGalaxy translates raw source code into an explorable physical system, allowing engineering teams to surgically target refactoring efforts and decouple massive "God Nodes."
🔭 Explore your own repositories in 3D: https://gitgalaxy.io/
🪐 GitGalaxy GitHub (Source & Documentation): https://github.com/squid-protocol/gitgalaxy
#GitGalaxy #Kubernetes #Golang #SoftwareArchitecture #DataVisualization #WebGPU #DependencyGraph #TechDebt #DevOps #OpenSource
Видео Mapping 2 Million Lines of Go: The Architecture of Kubernetes in 3D канала Joe Esquibel
Комментарии отсутствуют
Информация о видео
1 мая 2026 г. 18:49:32
00:00:39
Другие видео канала