- Популярные видео
- Авто
- Видео-блоги
- ДТП, аварии
- Для маленьких
- Еда, напитки
- Животные
- Закон и право
- Знаменитости
- Игры
- Искусство
- Комедии
- Красота, мода
- Кулинария, рецепты
- Люди
- Мото
- Музыка
- Мультфильмы
- Наука, технологии
- Новости
- Образование
- Политика
- Праздники
- Приколы
- Природа
- Происшествия
- Путешествия
- Развлечения
- Ржач
- Семья
- Сериалы
- Спорт
- Стиль жизни
- ТВ передачи
- Танцы
- Технологии
- Товары
- Ужасы
- Фильмы
- Шоу-бизнес
- Юмор
Hanging Man Candlestick Pattern | How to Use the Hanging Man Pattern for Reliable Reversals
Hanging Man Candlestick Pattern | How to Use the Hanging Man Pattern for Reliable Reversals
What is the Hanging Man Candlestick Pattern?
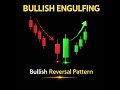
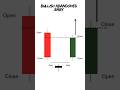
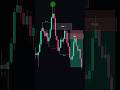
The Hanging Man is a single-candle bearish reversal pattern that typically forms after a sustained uptrend, signaling that buyers may be losing control to sellers. Its name comes from its visual resemblance to a person hanging from a rope, with the small body at the top and a long lower shadow dangling below .
Key Characteristics of the Hanging Man Pattern
1. Small real body at or near the top of the candle's trading range (can be bullish/green or bearish/red, though red is considered more bearish)
2. Long lower shadow (wick) that should be at least twice the length of the real body
3. Little to no upper shadow - indicating prices didn't trade significantly above the opening level
4. Forms after an uptrend - this context is crucial as the same candle in a downtrend would be considered a Hammer (bullish pattern)
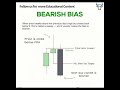
The psychology behind the Hanging Man reflects a shift in market sentiment. After a period of bullish control, sellers aggressively push prices down during the session (creating the long lower shadow), but buyers manage to rally prices back near the open by the close. This struggle suggests weakening bullish conviction .
How to Identify a Valid Hanging Man Pattern
Proper identification is crucial since misreading this pattern can lead to poor trading decisions. Here's a step-by-step approach:
1. Confirm the existing trend: The pattern must appear after a clear uptrend, not during consolidation or a downtrend .
2. Analyze the candle structure:
- Small body (difference between open and close)
- Lower shadow at least 2x body length
- Minimal upper shadow
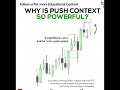
3. Consider volume: Higher trading volume during the Hanging Man formation strengthens the signal as it shows increased participation in the selling pressure .
- Hanging Man candlestick
- Bearish reversal pattern
- Candlestick trading strategy
- Technical analysis patterns
- Stock market reversal signals
- Forex trading candlesticks
- How to trade Hanging Man
- Price action trading
- Candlestick chart patterns
- Swing trading strategies
#HangingManPattern
#CandlestickTrading
#BearishReversal
#TechnicalAnalysis
#StockMarketTrading
#ForexTrading
#PriceAction
#SwingTrading
#DayTrading
#TradingStrategies
#ChartPatterns
#InvestingTips
#TradingEducation
#MarketReversals
#CandlestickChart
#FinancialMarkets
#TradingSignals
#StockTrading
#CryptoTrading
#SupportAndResistance
#RiskManagement
#TradingPsychology
#TradingForBeginners
#BullishToBearish
#TradingSetup
Видео Hanging Man Candlestick Pattern | How to Use the Hanging Man Pattern for Reliable Reversals канала Crypto Trading Insights
What is the Hanging Man Candlestick Pattern?
The Hanging Man is a single-candle bearish reversal pattern that typically forms after a sustained uptrend, signaling that buyers may be losing control to sellers. Its name comes from its visual resemblance to a person hanging from a rope, with the small body at the top and a long lower shadow dangling below .
Key Characteristics of the Hanging Man Pattern
1. Small real body at or near the top of the candle's trading range (can be bullish/green or bearish/red, though red is considered more bearish)
2. Long lower shadow (wick) that should be at least twice the length of the real body
3. Little to no upper shadow - indicating prices didn't trade significantly above the opening level
4. Forms after an uptrend - this context is crucial as the same candle in a downtrend would be considered a Hammer (bullish pattern)
The psychology behind the Hanging Man reflects a shift in market sentiment. After a period of bullish control, sellers aggressively push prices down during the session (creating the long lower shadow), but buyers manage to rally prices back near the open by the close. This struggle suggests weakening bullish conviction .
How to Identify a Valid Hanging Man Pattern
Proper identification is crucial since misreading this pattern can lead to poor trading decisions. Here's a step-by-step approach:
1. Confirm the existing trend: The pattern must appear after a clear uptrend, not during consolidation or a downtrend .
2. Analyze the candle structure:
- Small body (difference between open and close)
- Lower shadow at least 2x body length
- Minimal upper shadow
3. Consider volume: Higher trading volume during the Hanging Man formation strengthens the signal as it shows increased participation in the selling pressure .
- Hanging Man candlestick
- Bearish reversal pattern
- Candlestick trading strategy
- Technical analysis patterns
- Stock market reversal signals
- Forex trading candlesticks
- How to trade Hanging Man
- Price action trading
- Candlestick chart patterns
- Swing trading strategies
#HangingManPattern
#CandlestickTrading
#BearishReversal
#TechnicalAnalysis
#StockMarketTrading
#ForexTrading
#PriceAction
#SwingTrading
#DayTrading
#TradingStrategies
#ChartPatterns
#InvestingTips
#TradingEducation
#MarketReversals
#CandlestickChart
#FinancialMarkets
#TradingSignals
#StockTrading
#CryptoTrading
#SupportAndResistance
#RiskManagement
#TradingPsychology
#TradingForBeginners
#BullishToBearish
#TradingSetup
Видео Hanging Man Candlestick Pattern | How to Use the Hanging Man Pattern for Reliable Reversals канала Crypto Trading Insights
Комментарии отсутствуют
Информация о видео
1 июля 2025 г. 17:06:43
00:00:29
Другие видео канала