- Популярные видео
- Авто
- Видео-блоги
- ДТП, аварии
- Для маленьких
- Еда, напитки
- Животные
- Закон и право
- Знаменитости
- Игры
- Искусство
- Комедии
- Красота, мода
- Кулинария, рецепты
- Люди
- Мото
- Музыка
- Мультфильмы
- Наука, технологии
- Новости
- Образование
- Политика
- Праздники
- Приколы
- Природа
- Происшествия
- Путешествия
- Развлечения
- Ржач
- Семья
- Сериалы
- Спорт
- Стиль жизни
- ТВ передачи
- Танцы
- Технологии
- Товары
- Ужасы
- Фильмы
- Шоу-бизнес
- Юмор
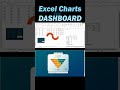
How to Build Combo Bar Chart in Excel for Interactive Dashboard Design
How to Create a Combo Bar Chart in Excel for an interactive and visually engaging dashboard.
Full Version Dashboard: https://exceltable.com/en/templates/best-dashboard-for-personal-finance-management-in-excel
All videos for development: https://www.youtube.com/watch?v=Wxf5XmWi1M4&list=PLj9PXoZSrCDe8Ne8JubrwWJSK1DTnZRsu
This tutorial shows step by step how to:
✅ Combine clustered columns and bar series
✅ How to make rounded chart columns
✅ Use PivotTable slicers to make your chart fully interactive.
Video Chapters ⏱️ ▶️
0:00 Introduction
0:37 Formula table for the interactive bar chart
1:03 Creating a standard template for a clustered column chart
1:37 Adjusting parameters for different data series in the chart
2:08 Adding PivotTable slicer buttons to control the chart
2:43 Designing a visual layout panel for the data visualization using shapes
3:25 Customizing the design of interactive control buttons for the bar chart
4:10 Creating a stylish design for the combo bar chart
7:59 Example of how to make rounded bars in an Excel bar chart
10:35 Adding dynamic data labels linked to formulas
12:02 Testing the interactive features of the combo bar chart in Excel
Chart Template for analyzing metrics, comparing categories, and creating professional dashboards in Excel.
You'll see how to:
✅ Combine multiple chart types in one visualization
✅ Add dynamic data labels linked to formulas
✅ Style your chart with rounded bars and modern design
This approach helps you present complex data clearly, track performance trends, and make dashboards more insightful and visually appealing.
#ExcelComboChart
Видео How to Build Combo Bar Chart in Excel for Interactive Dashboard Design канала Excel Visual
Комментарии отсутствуют
Информация о видео
13 ноября 2025 г. 2:49:08
00:12:43
Другие видео канала