Python Plotting Tutorial w/ Matplotlib & Pandas (Line Graph, Histogram, Pie Chart, Box & Whiskers)
Practice your Python Pandas data science skills with problems on StrataScratch!
https://stratascratch.com/?via=keith
In this video, we go through several real-world examples of using the Matplotlib & Pandas libraries to visualize data from CSV files. This is a follow-up to my introductory matplotlib video (https://youtu.be/DAQNHzOcO5A). Timeline for what we cover can be found in the comments.
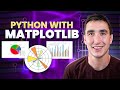
We start by creating line graphs of global gas price data over time. We review how to add a title, x & y axis labels, and scale our graph. We review how to customize the style and size of our charts. Next, we look at the FIFA 19 player data to create a histogram, a couple pie charts, and a box and whisker plot.
If you enjoy this video, make sure to LIKE and SUBSCRIBE :) :)
If you have any questions or feedback, please let me know in the comments!
---------------------------------------------
Follow me on social media!
Instagram | https://www.instagram.com/keithgalli/
Twitter | https://twitter.com/keithgalli
---------------------------------------------
Link to Source Code & Datasets!
https://github.com/KeithGalli/matplotlib_tutorial
Matplotlib Documentation:
https://matplotlib.org/api/_as_gen/matplotlib.pyplot.html
Matplotlib Fonts:
http://jonathansoma.com/lede/data-studio/matplotlib/list-all-fonts-available-in-matplotlib-plus-samples/
Matplotlib Style Options:
https://matplotlib.org/3.1.0/gallery/style_sheets/style_sheets_reference.html
Kaggle Data Link:
https://www.kaggle.com/karangadiya/fifa19
---------------------------------------------
Video timeline!
0:00 - Intro & Video Overview
2:22 - Load Necessary Libraries & Download Data
3:48 - Line Graph Example (Plotting Data from CSV file)
21:52 - Histogram Example (FIFA Overall Skill Distribution)
29:25 - Pie Chart #1 (Counting data in CSV) - Visualizing Soccer Foot Preferences
36:41 - Pie Chart #2 (More advance Pandas Example) - Weight Distribution of FIFA Players
47:49 - Box & Whisker Plot (Comparing FIFA teams to one another)
1:00:37 - Final Comments
---------------------
If you are curious to learn how I make my tutorials, check out this video: https://youtu.be/LEO4igyXbLs
Join the Python Army to get access to perks!
YouTube - https://www.youtube.com/channel/UCq6XkhO5SZ66N04IcPbqNcw/join
Patreon - https://www.patreon.com/keithgalli
*I use affiliate links on the products that I recommend. I may earn a purchase commission or a referral bonus from the usage of these links.
Видео Python Plotting Tutorial w/ Matplotlib & Pandas (Line Graph, Histogram, Pie Chart, Box & Whiskers) канала Keith Galli
https://stratascratch.com/?via=keith
In this video, we go through several real-world examples of using the Matplotlib & Pandas libraries to visualize data from CSV files. This is a follow-up to my introductory matplotlib video (https://youtu.be/DAQNHzOcO5A). Timeline for what we cover can be found in the comments.
We start by creating line graphs of global gas price data over time. We review how to add a title, x & y axis labels, and scale our graph. We review how to customize the style and size of our charts. Next, we look at the FIFA 19 player data to create a histogram, a couple pie charts, and a box and whisker plot.
If you enjoy this video, make sure to LIKE and SUBSCRIBE :) :)
If you have any questions or feedback, please let me know in the comments!
---------------------------------------------
Follow me on social media!
Instagram | https://www.instagram.com/keithgalli/
Twitter | https://twitter.com/keithgalli
---------------------------------------------
Link to Source Code & Datasets!
https://github.com/KeithGalli/matplotlib_tutorial
Matplotlib Documentation:
https://matplotlib.org/api/_as_gen/matplotlib.pyplot.html
Matplotlib Fonts:
http://jonathansoma.com/lede/data-studio/matplotlib/list-all-fonts-available-in-matplotlib-plus-samples/
Matplotlib Style Options:
https://matplotlib.org/3.1.0/gallery/style_sheets/style_sheets_reference.html
Kaggle Data Link:
https://www.kaggle.com/karangadiya/fifa19
---------------------------------------------
Video timeline!
0:00 - Intro & Video Overview
2:22 - Load Necessary Libraries & Download Data
3:48 - Line Graph Example (Plotting Data from CSV file)
21:52 - Histogram Example (FIFA Overall Skill Distribution)
29:25 - Pie Chart #1 (Counting data in CSV) - Visualizing Soccer Foot Preferences
36:41 - Pie Chart #2 (More advance Pandas Example) - Weight Distribution of FIFA Players
47:49 - Box & Whisker Plot (Comparing FIFA teams to one another)
1:00:37 - Final Comments
---------------------
If you are curious to learn how I make my tutorials, check out this video: https://youtu.be/LEO4igyXbLs
Join the Python Army to get access to perks!
YouTube - https://www.youtube.com/channel/UCq6XkhO5SZ66N04IcPbqNcw/join
Patreon - https://www.patreon.com/keithgalli
*I use affiliate links on the products that I recommend. I may earn a purchase commission or a referral bonus from the usage of these links.
Видео Python Plotting Tutorial w/ Matplotlib & Pandas (Line Graph, Histogram, Pie Chart, Box & Whiskers) канала Keith Galli
Показать
Комментарии отсутствуют
Информация о видео
Другие видео канала
 Intro to Data Visualization in Python with Matplotlib! (line graph, bar chart, title, labels, size)
 Intro to Data Analysis / Visualization with Python, Matplotlib and Pandas | Matplotlib Tutorial
 How to plot multiple sub-plots using Matplotlib and Seaborn | Session With Sumit
 Seaborn Tutorial 2021
 How to Generate an Analytics Report (pdf) in Python!
 Matplotlib Tutorial (Part 1): Creating and Customizing Our First Plots
 How to learn to code (quickly and easily!)
 Solving real world data science tasks with Python Pandas!
 Python Data Science Project Ideas! (for all skill levels)
 What is Pandas? Why and How to Use Pandas in Python
 Matplotlib Crash Course
 Complete Python Pandas Data Science Tutorial! (Reading CSV/Excel files, Sorting, Filtering, Groupby)
 How I became an unemployed MIT grad still living with my parents.
 Ultimate Guide to Pandas! Tricks, Shortcuts, Must Know Commands! Python for Beginners
 Python Line Charts
 Matplotlib Tutorial (Part 9): Plotting Live Data in Real-Time
 Complete Python NumPy Tutorial (Creating Arrays, Indexing, Math, Statistics, Reshaping)
 Pandas Histogram | pd.DataFrame.hist()
 Plot Grouped Bar Graph With Python and Pandas