Graphing Logarithmic Functions
This algebra video tutorial explains how to graph logarithmic functions using transformations and a data table. It explains how to identify the vertical asymptote as well as the domain and range of the logarithmic function in interval notation. This video contains plenty of examples and practice problems.
New Algebra Playlist:
https://www.youtube.com/watch?v=nTn9gVqRfKY&list=PL0o_zxa4K1BUeF2o-MlNpbRiS-oE2Kn6J&index=2
Access to Premium Videos:
https://www.patreon.com/MathScienceTutor
https://www.facebook.com/MathScienceTutoring/
Видео Graphing Logarithmic Functions канала The Organic Chemistry Tutor
New Algebra Playlist:
https://www.youtube.com/watch?v=nTn9gVqRfKY&list=PL0o_zxa4K1BUeF2o-MlNpbRiS-oE2Kn6J&index=2
Access to Premium Videos:
https://www.patreon.com/MathScienceTutor
https://www.facebook.com/MathScienceTutoring/
Видео Graphing Logarithmic Functions канала The Organic Chemistry Tutor
Показать
Комментарии отсутствуют
Информация о видео
30 января 2018 г. 17:00:01
00:12:03
Другие видео канала
 Learning to graph a logarithm step by step by applying transformations
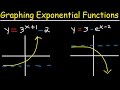 Graphing Exponential Functions With e, Transformations, Domain and Range, Asymptotes, Precalculus
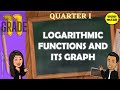 LOGARITHMIC FUNCTIONS AND ITS GRAPH || GRADE 11GENERAL MATHEMATICS Q1
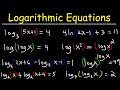 Solving Logarithmic Equations
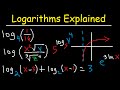 Logarithms Explained Rules & Properties, Condense, Expand, Graphing & Solving Equations Introduction

 Logarithms... How? (NancyPi)
 Graphing logarithmic equations
 can you solve this logarithm equation with different bases?
 Logarithms Review - Exponential Form - Graphing Functions & Solving Equations - Algebra
 Properties of Logarithms
 Logs Everything You Need to Know
 Graphing Logarithmic Functions with Transformations
 Graphing Logarithmic Functions With Transformations, Asymptotes, and Domain & Range
![A-Level Maths: F3-03 [Logarithms: Graphing Logarithmic Functions]](https://i.ytimg.com/vi/GVm9y1NN1b4/default.jpg) A-Level Maths: F3-03 [Logarithms: Graphing Logarithmic Functions]
A-Level Maths: F3-03 [Logarithms: Graphing Logarithmic Functions] The Graph of Logarithmic Functions I Señor Pablo TV
 Introduction to Logarithms
 How to graph an exponential function using a table
 Logarithms - Graphing Exponential and Logarithmic Functions | Logs | Don't Memorise