Graphing Exponential Functions With e, Transformations, Domain and Range, Asymptotes, Precalculus
This algebra 2 and precalculus video tutorial focuses on graphing exponential functions with e and using transformations. It explains how to find and write the domain and range of the function in addition to identify the horizontal asymptote. It shows you how to use a data table to plot at least two points to draw an accurate sketch of the graph. This video contains plenty of examples and practice problems.
My Website: https://www.video-tutor.net
Patreon: https://www.patreon.com/MathScienceTutor
Amazon Store: https://www.amazon.com/shop/theorganicchemistrytutor
Видео Graphing Exponential Functions With e, Transformations, Domain and Range, Asymptotes, Precalculus канала The Organic Chemistry Tutor
My Website: https://www.video-tutor.net
Patreon: https://www.patreon.com/MathScienceTutor
Amazon Store: https://www.amazon.com/shop/theorganicchemistrytutor
Видео Graphing Exponential Functions With e, Transformations, Domain and Range, Asymptotes, Precalculus канала The Organic Chemistry Tutor
Показать
Комментарии отсутствуют
Информация о видео
16 января 2017 г. 16:20:44
00:10:13
Другие видео канала
 Graphing Logarithmic Functions With Transformations, Asymptotes, and Domain & Range
 How to graph exponential functions
 What is the number "e" and where does it come from?
 Exponential Growth and Decay Word Problems & Functions - Algebra & Precalculus
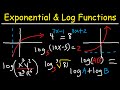 Logarithms Review - Exponential Form - Graphing Functions & Solving Equations - Algebra
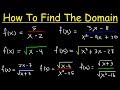 How To Find The Domain of a Function - Radicals, Fractions & Square Roots - Interval Notation
 Graphing Rational Functions With Vertical, Horizontal & Slant Asymptotes, Holes, Domain & Range
 Graphing Exponential Functions with Transformations
 07 - What is an Exponential Function? (Exponential Growth, Decay & Graphing).
 How to determine, domain range, and the asymptote for an exponential graph
 Sketch Graph of Exponential Function y = e^(-x^2) in Details
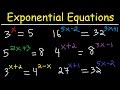 Solving Exponential Equations With Different Bases Using Logarithms - Algebra
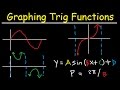 Graphing Trigonometric Functions, Phase Shift, Period, Transformations, Tangent, Cosecant, Cosine
 An Introduction to Graphing Exponential Functions
 Graphing an exponential function using transformations
 Domain and Range of Exponential Functions
 Solving Logarithmic Equations With Logs on Both Sides, Ln, e, Square Roots - Algebra
 Horizontal and Vertical Asymptotes - Slant / Oblique - Holes - Rational Function - Domain & Range
 Exponential Graphs - Corbettmaths