- Лайфстайл
- Недвижимость
- Здоровье
- Природа
- Дизайн
- Техника и оборудование
- Бизнес и предпринимательство
- Искусство
- Религия
- Строительство и ремонт
- Сад и огород
- Аудиокниги
- Кулинария
- Интервью
- Развлечения
- Лайфхаки
- Эзотерика
- Охота и рыбалка
- Наука
- Политика
- Психология
- Аудио
- Технологии и интернет
- Красота
- Телепередачи
- Детям
- Аниме
- Хобби
- Видеоигры
- Юмор
- Образование
- Спорт
- Разное
- Путешествия
- Животные
- Новости и СМИ
- Мультфильмы
- Музыка
- Сериалы
- Фильмы
- Авто-мото
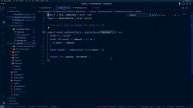
How To Debug Python Code In Visual Studio Code (VSCode)
How To Debug Python Code In Visual Studio Code (VSCode)
1. **Install Python Extension**: If you haven't already, install the Python extension for VS Code. You can do this from the Extensions view by searching for "Python."
2. **Open Your Python Project**: Open the Python project you want to debug in VS Code.
3. **Create a Debug Configuration**:
- Click on the gear icon in the Activity Bar on the side or use `Ctrl + Shift + D` to open the Run and Debug sidebar.
- Click on the "create a launch.json file" link or select "Add Configuration" if you already have a `launch.json` file.
4. **Select Python Configuration**: In the list of available configurations, choose "Python."
5. **Configure Debug Settings**:
- In the `launch.json` file, you can configure various settings, such as the Python interpreter, script to debug, and more. Here's a basic example:
```json
{
"version": "0.2.0",
"configurations": [
{
"name": "Python: Current File",
"type": "python",
"request": "launch",
"program": "${file}",
"console": "integratedTerminal"
}
]
}
```
You can modify this configuration as needed.
6. **Set Breakpoints**:
- Open the Python file you want to debug.
- Click in the gutter next to the line number to set a breakpoint. Alternatively, you can use the `F9` key.
7. **Start Debugging**:
- Click the green "Start Debugging" button in the Run and Debug sidebar or press `F5`. This will start debugging your Python script.
8. **Debugging Actions**:
- While debugging, you can use common debugging actions like step into (`F11`), step over (`F10`), continue (`F5`), and stop debugging (`Shift + F5`).
9. **Inspect Variables**:
- Use the Variables panel to inspect the values of variables in your code.
10. **Watch Expressions**:
- You can add watch expressions to monitor specific variables or expressions during debugging.
11. **Interactive Debugging**:
- VS Code provides an interactive console in the Debug Console tab where you can run Python commands while debugging.
12. **Finish Debugging**:
- When you're done debugging, you can stop the debugger by clicking the red square "Stop" button or using `Shift + F5`.
That's the basic process for debugging Python in Visual Studio Code. You can further customize your debugging experience by modifying the `launch.json` configuration to suit your specific needs.
#Python #Debugging #VisualStudioCode #VSCode #ProgrammingTutorial #DebuggingTutorial #CodeEditor #Breakpoints #Variables #Expressions #Runtime #ConsolePrinting #BeginnerFriendly #ProgrammingEducation
#howtodebugpython
#howtodebugpythoninvscode
#howtodebugpythoninvisualstudiocode
#debugging
#debugpythoncode
#debugpythoncodeinvscode
#debugpythoninide
like ,share ,subscribe & press on bell icon.
:)https://www.facebook.com/AppliedProgrammingTipsByDineshKushwaha/
:)https://www.linkedin.com/in/dinesh-kushwaha-757a30136
:)https://twitter.com/2kushDinesh
:)http://aptcode.in/
Видео How To Debug Python Code In Visual Studio Code (VSCode) автора Python реальность
Видео How To Debug Python Code In Visual Studio Code (VSCode) автора Python реальность
Информация

2 декабря 2023 г. 11:46:20
00:06:56
Похожие видео
![MoscowPython Meetup 77. Как Django и Alchemy (не) справляются со сложным SQL [zgC9f4x8pcU]](http://pic.rutubelist.ru/video/2025-05-04/2e/57/2e576a802935541ab420ba30fa045f2b.jpg?size=s)