Create a simple yet powerful Dashboard in Excel
This video will walk you through the steps of creating a simple yet powerful interactive dashboard in Excel. #exceltutorial #exceltips
0:00 Preview
0:39 Dashboard design plan
4:16 Setup pivot tables
6:40 Create interactive charts and paste them to the Dashboard
10:00 Create slicers and paste them to the Dashboard
12:21 Create a summary table with scroll bar
19:49 Dashboard in action
NOTE:
This video assumes that you are comfortable with creating Pivot Tables. Here is my video that shows how to create a Pivot Table the right way: https://youtu.be/R5xhSw7VUi0
It also assumes that you know how to connect a Slicer to a Pivot Table. Here is my video that shows how you can insert Slicers in Excel: https://youtu.be/EpBVxHjpmyY
This video uses a scroll bar that is available in the Developer tab in Excel's ribbon. If this tab in not populated in your Excel, you can follow these steps to enable it:
1. Click the "File" menu, and then click "Options".
2. Click "Customize Ribbon". Then, on the right side under the list of "Main Tabs", click the checkbox for "Developer". Click OK.
3. The Developer tab will now appear in Excel's ribbon.
The excel workbook used in this video is located at:
https://github.com/geekoholic4ever/dashboard_1
Видео Create a simple yet powerful Dashboard in Excel автора Эксель для Работы с Финансовыми Моделями
Видео Create a simple yet powerful Dashboard in Excel автора Эксель для Работы с Финансовыми Моделями
Информация

6 декабря 2023 г. 4:41:58
00:20:27
Похожие видео
 43.003 Instance Methods Vs. Class Methods
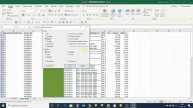 HOW TO PASTE DATA ONLY TO VISIBLE CELLS ON EXCEL
 Читаем График по Паттернам! У Валютных Пар Есть Свой Характер
 5 важных советов, чтобы стать хорошим проводником игры Лила
 Что наследуют по закону иждивенцы наследодателя
 Как увидеть свой пароль в Instagram, если вы его забыли (2023)| Посмотреть пароль от моего Instagra
 Fugoo Portable Bluetooth Speakers
 สาเหตุและวิธีแก้ปัญหาไฟล์ Excel มีขนาดใหญ่
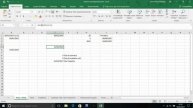 Curso Online de Excel da Fitti - Aula 4 Parte 7 - Fórmulas para datas
 рп отыгровка1
 Convert BAK File TO DWG File in AutoCAD | Bak File Not Opening | AutoCAD BAK FILE TO DWG FILE
 43.005 Static Methods
 01 Где искать задачи Курса Обучения по Битрикс24
 Н. В. Лукашов. О проблеме унификации для полимодальной логики доказуемости
 How to Download and Play Free Classic Games of Windows 7 on Windows 10 / 8
 TargetSeq™ on the 5500 Series Genetic Analyzer and SOLiD™ 4 Systems
 Quickly Resize All Columns in Excel - 1 Minute Master
 43.007 Abstract Classes and Abstract Methods
 Хороших Входов на Н1 Много Не Бывает Читаем Рынок по Свечам
 43.002 Instance Variables