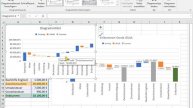
Sankey Chart in Power BI - Custom Visual
A Sankey chart is a type of data visualization that represents the flow of data or resources between different nodes. Sankey chart is useful for showing the relative contributions and losses at each stage of a process, as well as the overall trends and patterns in the system.
Overall, Sankey chart can be useful whenever you need to show the flow of data or resources in a clear manner
#powerbi #powerplatform #mspowerbi #microsoftpowerbi
Видео Sankey Chart in Power BI - Custom Visual автора Power BI учебный курс
Видео Sankey Chart in Power BI - Custom Visual автора Power BI учебный курс
Информация
18 января 2024 г. 21:44:05
00:03:44
Похожие видео
 CRM магазин в Битрикс24 Лондон
 Сборка 3д принтеров
 Как все буквы сделать маленькими в ворде
 Как в ворде поставить цифру над словом
 Dax tips and tricks WEEKDAY DAX Function
 Как поставить кавычки елочки в Ворде
 Тест
Тест Как двигать картинку в Ворде
 Integrations Community Call - Power BI 12 10 2021
 Infinix Smart 6 HD X6512 разблокировка удаление FRP Unlocktool
Infinix Smart 6 HD X6512 FRP
 CDL#1-Into: Ways to compare two or more variables in data visualization - Announcement
 Live Intraday Futures Orderflow Analysis | Charles AKA Piratetraders
 Как включить подсветку на клавиатуре ноутбука ардор
 Как поставить жирную точку в Ворде
 Как сделать обтекание картинки текстом в ворде
 ChatBot for Microsoft Power BI
 Diagramme - 13 - Wasserfall-Diagramme
 How to connect Azure Data Lake Gen2 through Power BI
 Как включить подсветку клавиатуры на ноутбуке xiaomi
 PUBG Mobile Lite #14 - Топ-1 (-9)
