Power BI Project: (Part 1) Building an Interactive Dashboard of Global Superstore Sales Data
Power BI Project: Part 1 - Analyzing Global Superstore Sales Data and Building an Interactive Dashboard @vairalnitin4322
In Part 1, we'll focus on analyzing global Superstore sales data and building an interactive dashboard. Here are the steps to get started:
Step 1: Import Data into Power BI
The first step is to import your data into Power BI. For this project, we'll be using the Global Superstore sales data, Once you've downloaded the data, you can import it into Power BI by selecting "Get Data" from the Home tab and choosing the appropriate file format (Excel, CSV, or Text/CSV).
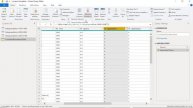
Step 2: Data Cleansing and Transformation
After importing the data, you'll need to perform some data cleansing and transformation to prepare it for analysis. This may include removing duplicates, filling in missing values, and formatting data types. You can use Power BI's built-in data transformation tools, such as the Query Editor, to perform these tasks.
Step 3: Create a Data Model
Once your data is cleaned and transformed, you'll need to create a data model to represent your data in Power BI. The data model should be designed to support the analysis you plan to do and should include all necessary relationships between tables.
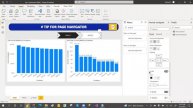
Step 4: Build Visualizations
Now that your data is ready, you can start building visualizations to explore the data. Power BI offers a wide range of visualization options, including charts, tables, maps, and more. You can use these tools to create a dashboard that provides a clear and concise overview of your data.
Step 5: Add Interactivity
To make your dashboard more engaging and interactive, you can add features such as filters, slicers, and drill-throughs. These tools allow users to explore the data in more detail and discover insights that may not be immediately apparent from the visualizations.
Step 6: Publish and Share
Finally, you can publish your dashboard to the Power BI service and share it with others. This allows your colleagues or stakeholders to access the dashboard and explore the data on their own.
With these steps, you should be well on your way to building an interactive dashboard using Power BI
#DataAnalytics
#businessintelligence
#powerbiprojects
#PowerBI
#DataVisualization
#DataScience
#DataDriven
#DataInsights
#BIReporting
#DashboardDesign
#DataDiscovery
#PowerQuery
#DataTransformation
#DataModeling
#DataMining
#DataPreparation
Видео Power BI Project: (Part 1) Building an Interactive Dashboard of Global Superstore Sales Data автора Power BI для бизнеса
Видео Power BI Project: (Part 1) Building an Interactive Dashboard of Global Superstore Sales Data автора Power BI для бизнеса
Информация

18 января 2024 г. 22:27:44
01:04:52
Похожие видео