- Популярные видео
- Авто
- Видео-блоги
- ДТП, аварии
- Для маленьких
- Еда, напитки
- Животные
- Закон и право
- Знаменитости
- Игры
- Искусство
- Комедии
- Красота, мода
- Кулинария, рецепты
- Люди
- Мото
- Музыка
- Мультфильмы
- Наука, технологии
- Новости
- Образование
- Политика
- Праздники
- Приколы
- Природа
- Происшествия
- Путешествия
- Развлечения
- Ржач
- Семья
- Сериалы
- Спорт
- Стиль жизни
- ТВ передачи
- Танцы
- Технологии
- Товары
- Ужасы
- Фильмы
- Шоу-бизнес
- Юмор
Advanced - POWER BI End To End Project - Retail Sales Performance Dashboard
Download Dataset File
https://1drv.ms/x/c/f04618cd78cca91c/IQBjwi3rvJ20RLy1jHkWGxY2AaRu6_JE3CmeiG6TrBxvL5A?e=sug7ek
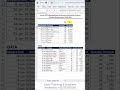
The Retail Sales Performance Dashboard – Power BI End-to-End Project
A comprehensive and visually engaging view of retail business performance, designed to support data-driven decision-making. As illustrated in the dashboard, key performance indicators such as Net Sales ($1.7M), Net Sales Quantity (25K), and Total Transactions (29,875) are prominently displayed, offering an instant snapshot of overall business health.
The dashboard incorporates interactive filters and slicers, allowing users to analyze performance across different time periods (current, prior, and monthly breakdowns) and product categories. A detailed product hierarchy treemap highlights the contribution of major segments like Office 365, Power Platform, and Xbox, enabling quick identification of top-performing products.
Store-level insights are provided through a category-wise bar chart, comparing sales across multiple locations and product lines. Additionally, the weekly sales trend line chart reveals fluctuations and growth patterns over time, helping stakeholders identify seasonality and emerging trends.
Customer-centric analysis is another key strength of this dashboard. Visuals such as sales by price range, gender, age group, and sales type (internal vs. external) provide deeper insights into customer behavior and purchasing patterns.
Overall, this end-to-end Power BI project demonstrates strong capabilities in data modeling, transformation, and visualization, delivering a dynamic and interactive reporting solution suitable for retail businesses aiming to optimize performance and strategy.
#PowerBI #PowerBIDashboard #RetailSalesDashboard #PowerBIProject #DataAnalytics #BusinessIntelligence #DashboardDesign #PowerBITutorial #RetailAnalytics #DataVisualization #PowerBIForBeginners #AdvancedPowerBI #PowerBITraining #SalesDashboard #DataAnalysis #BIProject #ExcelAndPowerBI #AnalyticsDashboard #DataStorytelling #MicrosoftPowerBI #PowerBICommunity #EndToEndProject #RetailSales #KPIDashboard #LearnPowerBI #PowerBIDeveloper #DashboardTutorial #DataDriven #PowerBIReports #YouTubeLearning
“Power BI Retail Sales Dashboard”
“End to End Power BI Project”
“Advanced Power BI Dashboard Tutorial”
“Retail Sales Analysis in Power BI”
Видео Advanced - POWER BI End To End Project - Retail Sales Performance Dashboard канала Rahim Zulfiqar Ali
https://1drv.ms/x/c/f04618cd78cca91c/IQBjwi3rvJ20RLy1jHkWGxY2AaRu6_JE3CmeiG6TrBxvL5A?e=sug7ek
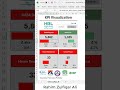
The Retail Sales Performance Dashboard – Power BI End-to-End Project
A comprehensive and visually engaging view of retail business performance, designed to support data-driven decision-making. As illustrated in the dashboard, key performance indicators such as Net Sales ($1.7M), Net Sales Quantity (25K), and Total Transactions (29,875) are prominently displayed, offering an instant snapshot of overall business health.
The dashboard incorporates interactive filters and slicers, allowing users to analyze performance across different time periods (current, prior, and monthly breakdowns) and product categories. A detailed product hierarchy treemap highlights the contribution of major segments like Office 365, Power Platform, and Xbox, enabling quick identification of top-performing products.
Store-level insights are provided through a category-wise bar chart, comparing sales across multiple locations and product lines. Additionally, the weekly sales trend line chart reveals fluctuations and growth patterns over time, helping stakeholders identify seasonality and emerging trends.
Customer-centric analysis is another key strength of this dashboard. Visuals such as sales by price range, gender, age group, and sales type (internal vs. external) provide deeper insights into customer behavior and purchasing patterns.
Overall, this end-to-end Power BI project demonstrates strong capabilities in data modeling, transformation, and visualization, delivering a dynamic and interactive reporting solution suitable for retail businesses aiming to optimize performance and strategy.
#PowerBI #PowerBIDashboard #RetailSalesDashboard #PowerBIProject #DataAnalytics #BusinessIntelligence #DashboardDesign #PowerBITutorial #RetailAnalytics #DataVisualization #PowerBIForBeginners #AdvancedPowerBI #PowerBITraining #SalesDashboard #DataAnalysis #BIProject #ExcelAndPowerBI #AnalyticsDashboard #DataStorytelling #MicrosoftPowerBI #PowerBICommunity #EndToEndProject #RetailSales #KPIDashboard #LearnPowerBI #PowerBIDeveloper #DashboardTutorial #DataDriven #PowerBIReports #YouTubeLearning
“Power BI Retail Sales Dashboard”
“End to End Power BI Project”
“Advanced Power BI Dashboard Tutorial”
“Retail Sales Analysis in Power BI”
Видео Advanced - POWER BI End To End Project - Retail Sales Performance Dashboard канала Rahim Zulfiqar Ali
Комментарии отсутствуют
Информация о видео
13 мая 2026 г. 19:23:02
01:03:54
Другие видео канала