- Популярные видео
- Авто
- Видео-блоги
- ДТП, аварии
- Для маленьких
- Еда, напитки
- Животные
- Закон и право
- Знаменитости
- Игры
- Искусство
- Комедии
- Красота, мода
- Кулинария, рецепты
- Люди
- Мото
- Музыка
- Мультфильмы
- Наука, технологии
- Новости
- Образование
- Политика
- Праздники
- Приколы
- Природа
- Происшествия
- Путешествия
- Развлечения
- Ржач
- Семья
- Сериалы
- Спорт
- Стиль жизни
- ТВ передачи
- Танцы
- Технологии
- Товары
- Ужасы
- Фильмы
- Шоу-бизнес
- Юмор
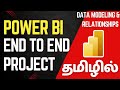
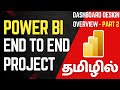
Build Executive Dashboard in Power BI | End-to-End Project (Tamil)
In this video, we continue building the Executive Overview Dashboard and answer the next business question 🧠
Which product or category is most important for the business?
We use a Clustered Column Chart to display Top 5 products based on Total Sales 📊
Instead of showing all products, we apply a Top N filter, which improves clarity and performance.
We sort the chart in descending order and enable data labels so business users can quickly understand which products are driving revenue.
Next, we explore Cross Highlighting vs Cross Filtering 🔄
By default, visuals highlight each other.
We change the report setting to cross filtering so selections dynamically filter other visuals instead of just highlighting them.
This makes the dashboard more interactive and powerful for storytelling.
Then we analyze Customer Behavior 👥
Using a 100% Stacked Column Chart, we compare Total Customers vs Returning Customers.
This helps business users understand customer retention percentage over time.
For ecommerce businesses, returning customers are more profitable than constantly acquiring new ones.
After that, we add Slicers 🎛️
We create a Date slicer from the Calendar table and optionally add Product or Category slicers.
We keep slicers minimal to avoid confusion and ensure the dashboard remains simple and powerful.
By the end of this video, you’ll understand how to design interactive visuals that support real business decisions, not just display data.
Pause the video and build the same visuals step by step inside Power BI.
If this video helped you, like 👍, share 🔁, and subscribe 🔔
#powerbi #dashboarddesign #powerbitamil #topn #datavisualization #businessintelligence #endtoendpowerbi #powerbiproject
Join this channel to get access to perks:
https://www.youtube.com/channel/UC_Xj4WopSDFuGI-gDE-PHjQ/join
📧 Have doubts? Drop your questions in the comments !
My Udemy Courses: https://www.udemy.com/user/bibrilliance/
Learn More Check out 👇
Power BI Ecommerce Dashboard End to End:
https://www.youtube.com/playlist?list=PL5c7Je8TkLOtst0MT1EN4PocaoSZhaPbb
Power BI Full Full Course:
https://www.youtube.com/playlist?list=PL5c7Je8TkLOvLJNQUcfK_jR126XUlhkZL
MCP Server in Power BI: https://www.youtube.com/playlist?list=PL5c7Je8TkLOupxO5S85brgsfVIRgLxj56
Power BI Optimization: https://www.youtube.com/playlist?list=PL5c7Je8TkLOtal3D93p4w3orB43Fo9Jnc
DAX Problem Solving: https://www.youtube.com/playlist?list=PL5c7Je8TkLOsdlnh6LN5FMn1_M00AQKGK
Power BI Service: https://www.youtube.com/playlist?list=PL5c7Je8TkLOsgkTYBGjTF4_4TqZPHssAJ
Power BI End to End Project:
https://www.youtube.com/playlist?list=PL5c7Je8TkLOvMwRg3s9goWGm_ZRllQ_56
Best Practices for DAX
https://www.youtube.com/playlist?list=PL5c7Je8TkLOsOIc6K2sfRs1J3Zp4demCo
Parameters: 📊🔧
https://www.youtube.com/playlist?list=PL5c7Je8TkLOsfJlUqOJHgFK6uJwONA0qt
DAX Expressions: ➗📐
https://www.youtube.com/playlist?list=PL5c7Je8TkLOvTKCDnars61yHjeLCmgXQN
Power BI for Beginners: 📈🎓
https://www.youtube.com/playlist?list=PL5c7Je8TkLOviEZCRjoddoP4SVVtwn9XZ
Power BI Advance Tutorial: 🚀📊
https://www.youtube.com/playlist?list=PL5c7Je8TkLOt2c--JlAWgMtXJY1N66G0y
Power BI Full Videos: 📊🎥
https://www.youtube.com/playlist?list=PL5c7Je8TkLOvLJNQUcfK_jR126XUlhkZL
Excel Basic Tutorial: 📅🔢
https://www.youtube.com/playlist?list=PL5c7Je8TkLOvIRF0deLX5lXS2QYIqleFM
Excel Advance Tutorial: 📊⚡
https://www.youtube.com/playlist?list=PL5c7Je8TkLOtLxzJq_r_8UvVyoKs-ewMa
Excel Keyboard Shortcuts: ⌨️🚀
https://www.youtube.com/playlist?list=PL5c7Je8TkLOttnedAv2rdtQBsiujJtvJ3
Enjoy your learning journey! 😊📚
📲 Follow me on social media for updates and tips:
👉 Follow on Instagram: https://www.instagram.com/bibrilliancetamil/profilecard/?igsh=eDh0dTNod2R3bnlu
👉 Join our WhatsApp Channel: https://www.whatsapp.com/channel/0029VasV7SU8fewhDZ3Cnq1t
👉 Read our blog: https://www.bibrilliance.com/
👍 Don’t forget to like, share, and subscribe for more Power BI Tamil tutorials!
Get started with Hostinger and enjoy amazing discounts!
Use my referral link to sign up and save:
👉 https://hostinger.in?REFERRALCODE=bibrilliance
Whether you're launching a blog, portfolio, or business site – Hostinger has you covered with fast, secure, and budget-friendly hosting plans. Don’t miss out!
Видео Build Executive Dashboard in Power BI | End-to-End Project (Tamil) канала BI Brilliance Tamil
power bi dashboard power bi top n filter power bi cross filtering power bi cross highlight power bi slicer tutorial power bi executive dashboard power bi returning customers power bi ecommerce dashboard power bi interactive visuals power bi tamil tutorial data analytics tamil business intelligence tamil
Комментарии отсутствуют
Информация о видео
18 февраля 2026 г. 19:01:37
00:06:03
Другие видео канала