How to Create a Column Chart with Single Target in Excel?
This video from the #datatodecisions series is about creating column charts in Excel with an additional target line.
This technique of displaying a column chart with a target line comes in handy when you have a specific target value for your measures.
Learn the simplest trick to create these column charts that display a target line that can be used to compare the measure value in the chart.
within minutes through this video.
***************************************************************************************************
Are you looking for a quick, instant chart-maker template where you can enter just data and have charts readily created for you?
Check our latest product, the Instant Chart Maker from our Data Visualization Toolkit in Excel: https://indzara.com/product/data-visualization-excel-templates/data-visualization-toolkit/
Check our Premium Column Chart Excel Template from Indzara here:
https://indzara.com/product/data-visualization-excel-templates/column-chart-excel-template/
For other visualization templates, please visit:
https://indzara.com/data-visualization-excel-templates/
Check our detailed blog post here:
https://indzara.com/create-column-chart-with-target-line/
For tutorials that address common Excel problems, visit https://indzara.com/datatodecisions/
#excelmadeeasy #exceltips #excelchartstutorial #exceltricks #datavisualization
Видео How to Create a Column Chart with Single Target in Excel? канала Indzara - Simple and Effective Templates
Комментарии отсутствуют
Информация о видео
31 января 2024 г. 18:30:34
00:07:05
Другие видео канала
 Recruitment Manager – Excel Template (Customer Review)
 How to Create Bar within a Bar Chart in Excel?
 How to Create a Box and Whisker Plot Chart in Excel?
 Vacation & Attendance Tracker Dashboard - Ch 4 Lesson 4 - Employee Report - Start and End Dates
 How to create NFL grid visual with logos of teams in Microsoft Excel
 How to Create a Column Chart to Highlight Columns above a Target Value in Excel?
 Moving Average Envelope Excel Template
 Student Attendance Register – Excel Template (Customer Reviews)
 Flight Risk Management Google Spreadsheet Template Demo
 📊 Backtest Your Trading Strategy with Ease! 🚀
 Useful Excel for Beginners - Chapter 9 Lesson 6 - Chart Components Format Design
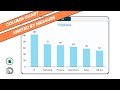 Learn to Create a Dynamic Column Chart Limited by a Measure Value in Excel
 Useful Excel for Beginners - Chapter 13 Lesson 1 - FinalThoughts
 How to migrate data from v1 to v2 of Retention Dashboard Excel Template?
 Introduction to Column Chart or Vertical Bar Chart in Excel
 How to create Diversity Reports in HR Administration Dashboard?
 Event Calendar Maker - Excel Template - v3 - Demo
 Tornado Charts in Excel: For Only Positive Values Explained!
 Useful Excel for Beginners - Chapter 8 Lesson 16 - Calculations - Errors
 Project Management Toolkit - Excel Templates (Customer Reviews)