- Популярные видео
- Авто
- Видео-блоги
- ДТП, аварии
- Для маленьких
- Еда, напитки
- Животные
- Закон и право
- Знаменитости
- Игры
- Искусство
- Комедии
- Красота, мода
- Кулинария, рецепты
- Люди
- Мото
- Музыка
- Мультфильмы
- Наука, технологии
- Новости
- Образование
- Политика
- Праздники
- Приколы
- Природа
- Происшествия
- Путешествия
- Развлечения
- Ржач
- Семья
- Сериалы
- Спорт
- Стиль жизни
- ТВ передачи
- Танцы
- Технологии
- Товары
- Ужасы
- Фильмы
- Шоу-бизнес
- Юмор
IBM IBDA 2026-04-01 | Module 8 Live Session | Data Visualization, Dashboards & Data Apps
In this live session for Module 8 of the IBM Data Analytics Professional Certificate, IBDA 2026-04-01 cohort, we explore data visualization, dashboard design, and data applications using Python.
This week focuses on how analysts move from cleaned and structured data into the consumption layer: static reports, exploratory visualizations, business intelligence dashboards, and interactive data apps that help stakeholders understand data and make decisions.
We begin with the role of visualization in data analytics, including how charts support exploration, reporting, and self-service analytics. From there, we review common visualization types, discuss how misleading charts can distort a story, and work through Python visualization tools including Matplotlib, Pandas plotting, Seaborn, Folium, Plotly, and Dash.
In this session, we cover:
• Why data visualization matters in analytics
• The three major use cases for visualization: static reporting, exploratory data analysis, and interactive dashboards
• How visualizations fit into the consumption layer of the data ecosystem
• Turning tables into clear, honest, and actionable visualizations
• Choosing the right chart type for the analytical question
• Line charts for time-series analysis
• Bar charts for categorical comparisons
• Histograms, box plots, violin plots, and density plots for understanding distributions
• Scatter plots for relationships and correlations
• Area charts, pie charts, bubble charts, waffle charts, and word clouds
• Why pie charts can be difficult to interpret
• How bad axes, poor proportions, clutter, and misleading scales can distort a visualization
• Data visualization as both truth-telling and storytelling
• Edward Tufte’s principles, chart junk, and data-to-ink ratio
• Matplotlib as the foundation for Python visualization
• Pandas plotting for quick charts directly from DataFrames
• Seaborn for statistical visualization and regression plots
• Folium for interactive maps and geographic data
• Plotly and Dash for interactive dashboards and data apps
• BI dashboards vs custom data applications
• How tools like Tableau, Power BI, Looker, Qlik, and QuickSight relate to coded dashboards
• Why data apps can provide more flexibility than traditional BI dashboards
• How dashboards support self-service analytics for non-technical stakeholders
We also work through several hands-on examples, including:
• Cleaning and preparing Canadian immigration data
• Visualizing immigration trends from Haiti after the 2010 earthquake
• Comparing immigration trends from India and China
• Identifying the top countries contributing immigration to Canada
• Reviewing area plots, histograms, bar charts, pie charts, box plots, scatter plots, and bubble charts
• Discussing misleading real-world visualizations and bad chart design
• Reviewing the decluttering discussion forum and the importance of readability
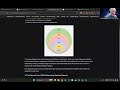
• Creating waffle charts to show proportion-of-whole comparisons
• Building word clouds from Alice in Wonderland text
• Masking a word cloud into the shape of an image
• Using Seaborn regression plots for statistical visualization
• Introducing geographic visualization with Folium
• Comparing BI dashboards and custom data apps
• Connecting dashboard concepts to Plotly Dash and interactive analytics
The big idea:
Data visualization is not just about making charts. It is about turning data into understanding.
A good visualization helps people see patterns, trends, outliers, relationships, and context. A bad visualization can confuse people, exaggerate differences, hide important details, or tell a misleading story.
As analytics work moves closer to decision-making, visualizations become more than static plots. They become dashboards, self-service analytics tools, and data applications that allow stakeholders to explore trusted data for themselves.
By the end of Module 8, you should have a stronger visualization toolkit and a better understanding of when to use static charts, statistical plots, maps, dashboards, BI tools, and custom data apps.
All notebooks and live session materials for this bootcamp are available here:
https://github.com/ABoothInTheWild/ibm_data_science
#dataanalytics #python #datavisualization #matplotlib #seaborn #plotly #dashboards #eda #businessintelligence #dataapps #analytics #ibm #bootcamp #education
Видео IBM IBDA 2026-04-01 | Module 8 Live Session | Data Visualization, Dashboards & Data Apps канала Alexander Booth
This week focuses on how analysts move from cleaned and structured data into the consumption layer: static reports, exploratory visualizations, business intelligence dashboards, and interactive data apps that help stakeholders understand data and make decisions.
We begin with the role of visualization in data analytics, including how charts support exploration, reporting, and self-service analytics. From there, we review common visualization types, discuss how misleading charts can distort a story, and work through Python visualization tools including Matplotlib, Pandas plotting, Seaborn, Folium, Plotly, and Dash.
In this session, we cover:
• Why data visualization matters in analytics
• The three major use cases for visualization: static reporting, exploratory data analysis, and interactive dashboards
• How visualizations fit into the consumption layer of the data ecosystem
• Turning tables into clear, honest, and actionable visualizations
• Choosing the right chart type for the analytical question
• Line charts for time-series analysis
• Bar charts for categorical comparisons
• Histograms, box plots, violin plots, and density plots for understanding distributions
• Scatter plots for relationships and correlations
• Area charts, pie charts, bubble charts, waffle charts, and word clouds
• Why pie charts can be difficult to interpret
• How bad axes, poor proportions, clutter, and misleading scales can distort a visualization
• Data visualization as both truth-telling and storytelling
• Edward Tufte’s principles, chart junk, and data-to-ink ratio
• Matplotlib as the foundation for Python visualization
• Pandas plotting for quick charts directly from DataFrames
• Seaborn for statistical visualization and regression plots
• Folium for interactive maps and geographic data
• Plotly and Dash for interactive dashboards and data apps
• BI dashboards vs custom data applications
• How tools like Tableau, Power BI, Looker, Qlik, and QuickSight relate to coded dashboards
• Why data apps can provide more flexibility than traditional BI dashboards
• How dashboards support self-service analytics for non-technical stakeholders
We also work through several hands-on examples, including:
• Cleaning and preparing Canadian immigration data
• Visualizing immigration trends from Haiti after the 2010 earthquake
• Comparing immigration trends from India and China
• Identifying the top countries contributing immigration to Canada
• Reviewing area plots, histograms, bar charts, pie charts, box plots, scatter plots, and bubble charts
• Discussing misleading real-world visualizations and bad chart design
• Reviewing the decluttering discussion forum and the importance of readability
• Creating waffle charts to show proportion-of-whole comparisons
• Building word clouds from Alice in Wonderland text
• Masking a word cloud into the shape of an image
• Using Seaborn regression plots for statistical visualization
• Introducing geographic visualization with Folium
• Comparing BI dashboards and custom data apps
• Connecting dashboard concepts to Plotly Dash and interactive analytics
The big idea:
Data visualization is not just about making charts. It is about turning data into understanding.
A good visualization helps people see patterns, trends, outliers, relationships, and context. A bad visualization can confuse people, exaggerate differences, hide important details, or tell a misleading story.
As analytics work moves closer to decision-making, visualizations become more than static plots. They become dashboards, self-service analytics tools, and data applications that allow stakeholders to explore trusted data for themselves.
By the end of Module 8, you should have a stronger visualization toolkit and a better understanding of when to use static charts, statistical plots, maps, dashboards, BI tools, and custom data apps.
All notebooks and live session materials for this bootcamp are available here:
https://github.com/ABoothInTheWild/ibm_data_science
#dataanalytics #python #datavisualization #matplotlib #seaborn #plotly #dashboards #eda #businessintelligence #dataapps #analytics #ibm #bootcamp #education
Видео IBM IBDA 2026-04-01 | Module 8 Live Session | Data Visualization, Dashboards & Data Apps канала Alexander Booth
Комментарии отсутствуют
Информация о видео
3 июня 2026 г. 20:28:18
01:18:07
Другие видео канала