Descriptive Statistic in R using gtsummary package || part 1 || proportion
Descriptive Statistic in R || part 1 || proportion
Please download the data example dataset “MyData.xlsx” from the below link and make a folder ‘abc’ in your D drive, and keep it this folder.
Data Source -
https://github.com/ahshanulhaque/MyData/raw/main/MyData.xlsx
#R #STATA #Ahshanul
library(readxl)
library(foreign)
library(haven)
library(tidyverse)
library(gtsummary)
The main topics of this channel are given below:
Sample size calculation
Data management in STATA and SPSS
Advance data analysis
Epidemiology
Видео Descriptive Statistic in R using gtsummary package || part 1 || proportion канала Biostatistics & Public Health Research
Показать
Комментарии отсутствуют
Информация о видео
6 января 2024 г. 13:08:46
00:06:23
Другие видео канала
 t-test to assess the difference of a quantitative variable between two group in STATA
 Practical session on logistic regression analysis in STATA || Childhood stunting
 Sample size calculation for randomized control trial and cohort study
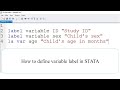 How to define variable label in STATA
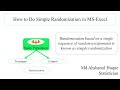 How to Do Simple Randomization in MS-Excel
 Value label and variable label in R
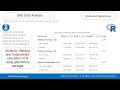 Stunting, Wasting and Underweight calculation in R using gtsummary package
 STATA: How to create Minimum Dietary Diversity for Women (MDD-W) indicator || A Guide to Measurement
 Geometric mean in STATA
 How to merge the Household Member Recode (PR) with Children's Recode (KR) in STATA
 Sample size calculation for estimating a mean in Excel
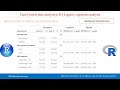 Case-Control data analysis in R using gtsummary || Logistic regression analysis
 Variable label and value label using ChatGPT in Stata
 Creating asset index or wealth index variable in STATA
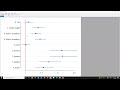 How to create forest plot in STATA || Odds ratio with 95% CI plot for logistic regression
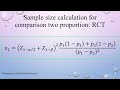 Sample size calculation for comparison two proportion: RCT
 BMI calculation in STATA || BDHS data
 Hypothesis test in STATA || Chi-square test to compare two categorical variables
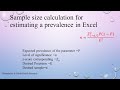 Sample size calculation for estimating a prevalence in Excel
 BDHS Data Analysis || sampling weight || Create improved toilet variable