Excel Charts - Creating a Revenue Forecast
This video demonstrates how a trendline could be added to a chart in Excel, to help create a revenue forecast.
Want to take your basic Excel skills to the next level? Take our online course and start impressing others: http://www.spreadsheetclinic.com/#!online-training/ce09
Видео Excel Charts - Creating a Revenue Forecast канала Spreadsheet Clinic
Want to take your basic Excel skills to the next level? Take our online course and start impressing others: http://www.spreadsheetclinic.com/#!online-training/ce09
Видео Excel Charts - Creating a Revenue Forecast канала Spreadsheet Clinic
Показать
Комментарии отсутствуют
Информация о видео
Другие видео канала
 Revenue Model Example: Forecasting in Excel
 Forecasting in Excel Tutorial
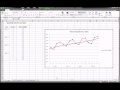 Excel - Time Series Forecasting - Part 1 of 3
![Monthly Budgeting & Forecasting Model [Template Included]](https://i.ytimg.com/vi/yJcL4et-ClY/default.jpg) Monthly Budgeting & Forecasting Model [Template Included]
Monthly Budgeting & Forecasting Model [Template Included] How to build Interactive Excel Dashboards that Update with ONE CLICK!
 Forecasting in Excel using Linear Regression
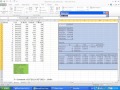 Using Multiple Regression in Excel for Predictive Analysis
 Forecasting in Excel Made SIMPLE (include seasonality & make predictions)
 Analyzing a sales pipeline in Excel to validate revenue growth assumptions for your financial plan
 Revenue Forecasting
 The Excel FORECAST Function
 Understanding Financial Projections Template Spreadsheet | Central Valley SCORE
 How to Forecast Revenue for YOUR Business | Revenue Forecast / Model Tutorial
 Income Statement Forecasting - How to do a 5 year forecast in excel
 Split Amount into Monthly Columns
 Introduction to Pivot Tables, Charts, and Dashboards in Excel (Part 1)
 The ULTIMATE Marketplace Financial Model | Build From Scratch
 How to Use Sale Forecast Function in MS Excel
 How to Build a Forecasting Model in Excel
 Forecasting revenues in Business Cases