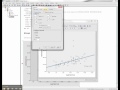
Scatter Plot with Fit Line (Excluding Equation) - SPSS
I demonstrate how to create a scatter plot with a fit line which either includes or excludes the regression equation. I also demonstrate how to add a second fit line to the scatter plot. This is second attempt at this video based on some comments that were left on the first video (thanks!).
Видео Scatter Plot with Fit Line (Excluding Equation) - SPSS канала how2stats
Видео Scatter Plot with Fit Line (Excluding Equation) - SPSS канала how2stats
Показать
Комментарии отсутствуют
Информация о видео
Другие видео канала
 Scatterplots and Correlation Coefficients in SPSS
 Scatter Plot for Multiple Regression
 Seaborn scatter plot | How to make and style a scatterplot in Python seaborn
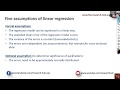 SPSS (16): Testing the five assumptions of linear regression in SPSS
 Regression and Prediction Equations in SPSS with Dr. Ami Gates
 How to do Regression Analysis for Likert Scale Data? Ordinal Logistic Regression Analysis
 Residuals, Predictions, Plots R
 Statistics: Scatter plots and Correlation Coefficient using Microsoft Excel: Urdu /Hindi
 Fixed effects panel regression in SPSS using Least squares dummy variable approach
 Correlation and ScatterPlots in SPSS with Dr. Ami Gates
 Spss v23 plot multiple line
 Bivariate Correlation in SPSS (SPSS Tutorial Video #15) - Pearson, Spearman, and Kendall's Tau-B
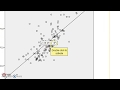 #SPSS v.23 : Lesson 115 / Scatter plots شكل الانتشار
 Scatter Plot - SPSS (part 1)
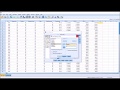 Testing the Normality of Residuals in a Regression using SPSS
 How to do Simple Linear Regression in SPSS (14-5)
 Nonlinear Regression Using Excel
 SPSS Demonstration: 4 Commonly Used Inferential Statistics
 Scatter Diagram: Detailed Illustration of Concept with Practical Examples