"Interpreting Central Venous Pressure Waveforms" by James DiNardo, MD, for OPENPediatrics
Learn principles of central venous pressure monitoring, including how to interpret the segments of a central venous pressure waveform and factors that influence the appearance of the waveform.
Please visit: www.openpediatrics.org
OPENPediatrics™ is an interactive digital learning platform for healthcare clinicians sponsored by Boston Children's Hospital and in collaboration with the World Federation of Pediatric Intensive and Critical Care Societies. It is designed to promote the exchange of knowledge between healthcare providers around the world caring for critically ill children in all resource settings. The content includes internationally recognized experts teaching the full range of topics on the care of critically ill children. All content is peer-reviewed and open access-and thus at no expense to the user.
For further information on how to enroll, please email: openpediatrics@childrens.harvard.edu
Please note: OPENPediatrics does not support nor control any related videos in the sidebar, these are placed by Youtube. We apologize for any inconvenience this may cause.
Interpreting Central Venous Pressure Waveforms, by Dr. James DiNardo.
Hi. My name is Jim DiNardo. I'm a Professor of Anesthesia at Harvard Medical School and one of the Cardiac ICU attendings here at Children's Hospital Boston. I'm going to talk now about our central venous pressure trace and the kind of information that we can get from a central venous pressure trace, and also about how a central venous pressure trace is generated and what implications that has.
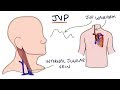
So again, it's important to remember that when we're measuring a CVP, we are in fact measuring a pressure in the central circulation, so in the superior vena cava or in the right atrium, depending on where the tip of the catheter is. But in fact, what's happening is this pressure is a consequence physiologically of volume changes in the superior vena cava or the right atrium in the setting of the compliance of those two systems.
What we see here when we look at a CVP trace, we see a volume moving in and out of the right atrium or the superior vena cava being represented as a pressure here. This pressure -- we're going to talk about this trace as one bead of the central venous pressure. You can see that there's a couple of waves here. So this first wave on the upstroke here is known as the A wave.
And you can see that is actually occurring - we can see with the simultaneous A line trace - as a late event in diastole. So here is end diastole in the arterial blood pressure traced right before the onset of systole. And if we look up here at the EKG, that same interval corresponds with the atrial contraction of the EKG. So this is an end diastolic event. And what this represents-- this is the pressure generated in the right atrium or the superior vena cava when the atrium contracts in a late diastole. And that is the pressure that's generated. And that pressure is a consequence of the volume of blood that's moving into the atrium and the compliance of the atrium.
So you can imagine a circumstance where, if you have a very compliant right atrium, even if you have a lot of volume moving in with the atrial contraction, the A wave is not going to be very big. By the same token, if I have a very non-compliant right atrium, a very young patient, and I have a lot of volume moving - and let's say they've been given a big volume infusion - and I have a very forceful atrial contraction, I'm going to see a big A wave here.
The next part of this CVP waveform is a C wave. You can see with a simultaneous A line trace that the C wave of occurs during the onset of ventricular systole. And if we look up here at the EKG, that same time interval corresponds to the R wave. What the C wave represents is bowing of the tricuspid valve back into the right atrium during systole such that there is a transient decrease in the atrial compliance and an increase in atrial pressure. During tachycardia, the C wave commonly becomes merged with the A wave. And under those circumstances, it's almost impossible to differentiate the A and the C waves.
This little down slope is known as the x descent. And the x descent actually represents-- we're going to be talking about systole now here. See, now we're under the systolic portion of the arterial line trace and we're into the QRS of the EKG. And it also represents a combination of factors. It represents the atrium relaxing. And as a consequence of that, the tricuspid valve apparatus is descending towards the apex of the ventricle. And that, in turn, results in the formation of this x descent.
Now, the next thing we see here is the V wave. And every human being that has a CVP line in has a V wave. The V wave is a late systolic event. You can see with the simultaneous A line trace that the V wave is occurring during late systole. And again, if we look up here at the EKG, this interval corresponds to the T wave of the EKG.
Видео "Interpreting Central Venous Pressure Waveforms" by James DiNardo, MD, for OPENPediatrics канала OPENPediatrics
Please visit: www.openpediatrics.org
OPENPediatrics™ is an interactive digital learning platform for healthcare clinicians sponsored by Boston Children's Hospital and in collaboration with the World Federation of Pediatric Intensive and Critical Care Societies. It is designed to promote the exchange of knowledge between healthcare providers around the world caring for critically ill children in all resource settings. The content includes internationally recognized experts teaching the full range of topics on the care of critically ill children. All content is peer-reviewed and open access-and thus at no expense to the user.
For further information on how to enroll, please email: openpediatrics@childrens.harvard.edu
Please note: OPENPediatrics does not support nor control any related videos in the sidebar, these are placed by Youtube. We apologize for any inconvenience this may cause.
Interpreting Central Venous Pressure Waveforms, by Dr. James DiNardo.
Hi. My name is Jim DiNardo. I'm a Professor of Anesthesia at Harvard Medical School and one of the Cardiac ICU attendings here at Children's Hospital Boston. I'm going to talk now about our central venous pressure trace and the kind of information that we can get from a central venous pressure trace, and also about how a central venous pressure trace is generated and what implications that has.
So again, it's important to remember that when we're measuring a CVP, we are in fact measuring a pressure in the central circulation, so in the superior vena cava or in the right atrium, depending on where the tip of the catheter is. But in fact, what's happening is this pressure is a consequence physiologically of volume changes in the superior vena cava or the right atrium in the setting of the compliance of those two systems.
What we see here when we look at a CVP trace, we see a volume moving in and out of the right atrium or the superior vena cava being represented as a pressure here. This pressure -- we're going to talk about this trace as one bead of the central venous pressure. You can see that there's a couple of waves here. So this first wave on the upstroke here is known as the A wave.
And you can see that is actually occurring - we can see with the simultaneous A line trace - as a late event in diastole. So here is end diastole in the arterial blood pressure traced right before the onset of systole. And if we look up here at the EKG, that same interval corresponds with the atrial contraction of the EKG. So this is an end diastolic event. And what this represents-- this is the pressure generated in the right atrium or the superior vena cava when the atrium contracts in a late diastole. And that is the pressure that's generated. And that pressure is a consequence of the volume of blood that's moving into the atrium and the compliance of the atrium.
So you can imagine a circumstance where, if you have a very compliant right atrium, even if you have a lot of volume moving in with the atrial contraction, the A wave is not going to be very big. By the same token, if I have a very non-compliant right atrium, a very young patient, and I have a lot of volume moving - and let's say they've been given a big volume infusion - and I have a very forceful atrial contraction, I'm going to see a big A wave here.
The next part of this CVP waveform is a C wave. You can see with a simultaneous A line trace that the C wave of occurs during the onset of ventricular systole. And if we look up here at the EKG, that same time interval corresponds to the R wave. What the C wave represents is bowing of the tricuspid valve back into the right atrium during systole such that there is a transient decrease in the atrial compliance and an increase in atrial pressure. During tachycardia, the C wave commonly becomes merged with the A wave. And under those circumstances, it's almost impossible to differentiate the A and the C waves.
This little down slope is known as the x descent. And the x descent actually represents-- we're going to be talking about systole now here. See, now we're under the systolic portion of the arterial line trace and we're into the QRS of the EKG. And it also represents a combination of factors. It represents the atrium relaxing. And as a consequence of that, the tricuspid valve apparatus is descending towards the apex of the ventricle. And that, in turn, results in the formation of this x descent.
Now, the next thing we see here is the V wave. And every human being that has a CVP line in has a V wave. The V wave is a late systolic event. You can see with the simultaneous A line trace that the V wave is occurring during late systole. And again, if we look up here at the EKG, this interval corresponds to the T wave of the EKG.
Видео "Interpreting Central Venous Pressure Waveforms" by James DiNardo, MD, for OPENPediatrics канала OPENPediatrics
Показать
Комментарии отсутствуют
Информация о видео
Другие видео канала
 Understanding Jugular Venous Pressure (JVP)
 CVP and Arterial Line Waveform Interpretation
 The Cardiac Cycle, Animation
 Vasopressors Explained Clearly: Norepinephrine, Epinephrine, Vasopressin, Dobutamine...
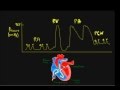 Schneid Guide to Cardiovascular Pressures with Right Heart Catheterization and Physical Exam
 "Transducers in Invasive Pressure Monitoring" by James DiNardo, MD for OPENPediatrics
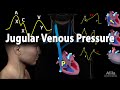 Jugular Venous Pressure, Animation
 Hemodynamic Basics for Nursing Students
 Arterial Line Management & Nursing Care | NCLEX Review
 Jugular venous pressure
 052 The Cardiac Cycle
 Swan Ganz Numbers: presented by Dr. Gallagher's Neighborhood
 CVP Tracing
 Human Physiology - Central Venous Pressure, Part 2
 "Interpreting Arterial Pressure Waveforms" by Jim DiNardo, MD, FAAP for OPENPediatrics
 Jugular Venous Pulse (JVP) Explained Clearly - Evaluation, Waveforms, Interpretation
 Invasive Arterial Blood Pressure Measurement
 Central Venous Pressure
 JVP waveform explained
 12 Lead ECG Explained, Animation