Generating Professional Two-Dimensional Graphics in MATLAB
This video shows the two main 2D function plotting functions imagesc() and pcolor() and goes on to show how to dress up plots in order to make professional graphics. As a bonus, a neat technique for generating a random 2D function is used to demonstrate the graphics techniques.
Be sure to visit the EMPossible Course website for updated lecture notes and course materials, as well as links to develop MATLAB codes. The Course page can be found here: https://empossible.net/academics/emp4301_5301/
Check out all of the EMPossible course materials and workshops: https://empossible.net/
Видео Generating Professional Two-Dimensional Graphics in MATLAB канала EMPossible
Показать
Комментарии отсутствуют
Информация о видео
Другие видео канала

 10 matlab 2D heatmap plot
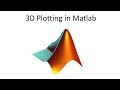 3D Plotting in Matlab
 MetPy Mondays #121 - What's the difference between imshow, pcolor, and pcolormesh?
 Developing a 2D Structured Mesh Generation Engine (easy implementation using MATLAB)
 Loading Data From Excel and Plotting in Matlab
 How the 2D FFT works
 Add Graphics to Complex Perspectives in Photoshop!
 Newton-Raphson Method with MATLAB code
 MATLAB Help - Images
 CGA Graphics - Not as bad as you thought!
 Solving Coupled Navier-Stokes and Energy Equation on a surface using MATLAB - (Momentum & Heat )
 Plotting Two Data Sets at the Same Time in MATLAB
 Plotting contour maps in MATLAB, Part 1
 Professional surface and contour plot in MATLAB
 Image segmentation using nearest neighbor classifier in Matlab
 Physicist Explains Dimensions in 5 Levels of Difficulty | WIRED
 Lab09_2: Vector Field
 creating a contour plot in Origin from a spreadsheet with x,y,z data
 Heatmaps using Matplotlib, Seaborn, and Pandas