Handling Date-Based Data on the X-Axis #ai #artificialintelligence #machinelearning #aiagent
@genaiexp Plotting date-based data requires special handling. Begin by converting your date data into a format Matplotlib can interpret, typically using Python's datetime module. Use plt.plot_date(dates, values) to plot. When dealing with extensive date ranges, adjust date ticks for clarity using plt.gcf().autofmt_xdate(). This function rotates and formats date labels, preventing overlaps. For more control, utilize matplotlib.dates.DateFormatter to specify date formats. Handling dates effectively is crucial for accurate time series analysis, enabling trends to be visualized over time. By mastering date-based plotting, you'll enhance your ability to work with temporal data in Matplotlib.
Видео Handling Date-Based Data on the X-Axis #ai #artificialintelligence #machinelearning #aiagent канала NextGen AI & Tech Explorer
Видео Handling Date-Based Data on the X-Axis #ai #artificialintelligence #machinelearning #aiagent канала NextGen AI & Tech Explorer
Комментарии отсутствуют
Информация о видео
16 апреля 2025 г. 5:19:10
00:00:44
Другие видео канала
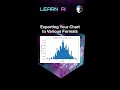 Exporting Your Chart to Various Formats #ai #artificialintelligence #machinelearning #aiagent
 Leveraging Open-source Datasets for Model Training #ai #artificialintelligence #machinelearning
 Exploring Apache Zeppelin for Data Visualization #ai #artificialintelligence #machinelearning
 Setting Clear Learning Objectives and Milestones #ai #artificialintelligence #machinelearning
 Choosing the Right Tools and Technologies for Data Lakes #ai #artificialintelligence #Choosing
 Incorporating Multiple Lines in a Single Chart #ai #artificialintelligence #machinelearning #aiagent
 Case Studies: Success Stories in AI-Assisted Diagnostics #ai #artificialintelligence #Case #Studies
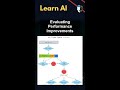 Evaluating Performance Improvements #ai #artificialintelligence #machinelearning #Evaluating
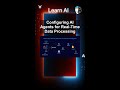 Configuring AI Agents for Real-Time Data Processing #ai #artificialintelligence #machinelearning
 Enhancing Patient Engagement with AI Assistants
 Choosing the Right Tools and Frameworks #ai #artificialintelligence #machinelearning #aiagent
 Data Privacy and Security Concerns #ai #artificialintelligence #machinelearning #aiagent #Data
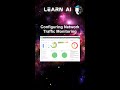 Configuring Network Traffic Monitoring #ai #artificialintelligence #machinelearning #aiagent
 AI-Powered Autonomous Vehicle Navigation
 Real-Time Analytics with Apache Kafka
 Dealing with Large Datasets: Performance Optimizations #ai #artificialintelligence #machinelearning
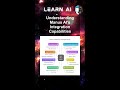 Understanding Manus AI's Integration Capabilities #ai #artificialintelligence #machinelearning
 Sensor Technologies and Data Fusion #ai #artificialintelligence #machinelearning #aiagent #Sensor
 Identifying p, d, q Parameters Using ACF and PACF #ai #artificialintelligence #machinelearning
 The Second Normal Form (2NF) #ai #artificialintelligence #machinelearning #aiagent #Second #Normal
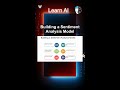 Building a Sentiment Analysis Model #ai #artificialintelligence #machinelearning #aiagent #Building