Tableau Dashboard for Twitter For Analyzing Tweets
Tableau Step by Step Complete Tutorial on how to design an interactive KPI dashboard for social media. Here I have taken twitter as an example for analyzing tweets for a particular celebrity to understand what are they tweeting, when are they tweeting and how much media engagement and interaction from users tweets are getting.
Want to learn advance tableau visualizations? Enroll in my training program. Contact me @ abhishek.agarrwal@gmail.com
You can follow me here on social media-
LinkedIn - https://www.linkedin.com/in/abhishek-agarwal-9549876/
Twitter - https://twitter.com/agarrwal7
Facebook - https://www.facebook.com/datantools
Видео Tableau Dashboard for Twitter For Analyzing Tweets канала Data Science Tutorials
Показать
Комментарии отсутствуют
Информация о видео
17 сентября 2021 г. 20:54:10
00:42:18
Другие видео канала
 Top 5 Design Techniques to Improve Business Dashboards
 Topics for Learning Power BI in 12 Day | Fast Track Power BI Learning Path
 Power BI ISError Function with IF condition to Identify and Process Errors
 Finding employees in hierarchy that is at a particular position Power BI using PathItem Function
 How to Set Power BI Small Multiple Axis as Shared Axis or Individual Axis
 How to get the Selected Start Date in a Field from Power BI Date Slicer
 How to create percent to total calculation using LOD in Tableau | Tableau Tips and Tricks
 How to Create GEO Map Chart in Google Data Studio
 Creating new Power BI Table from Existing Table but for rows that are not appearing in another table
 Power BI Dashboard Design For Human Resources | Dashboard in Power BI | Power BI Project - 2023
 Download and Install 64 bit Power BI 2 99 on Windows
 Sorting Power BI Visualization Based on Another Column
 How to Display very long tooltips in Power BI
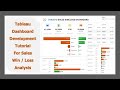 Tableau Dashboard Project for Sales Win Loss Analysis | Visualizing Win Loss Data in Tableau
 Creating Bump Chart in Power BI using Charticulator
 How to Dynamically change Power BI Y Axis Dimension for Stack Bar Chart | Parameters
 How To create New Column in Python Pandas DataFrame by Applying Condition on Numeric Column
 Tableau Dashboard Design Project Tutorial to Visualize Earthquake Data
 Power BI Line Chart Cumulative | Cumulative Sum on Line Chart | DAX for Cumulative Sum
 Power BI Custom Sorting Examples
 Power BI Sales Business Dashboard for Mobile with Measures as Slicers