- Популярные видео
- Авто
- Видео-блоги
- ДТП, аварии
- Для маленьких
- Еда, напитки
- Животные
- Закон и право
- Знаменитости
- Игры
- Искусство
- Комедии
- Красота, мода
- Кулинария, рецепты
- Люди
- Мото
- Музыка
- Мультфильмы
- Наука, технологии
- Новости
- Образование
- Политика
- Праздники
- Приколы
- Природа
- Происшествия
- Путешествия
- Развлечения
- Ржач
- Семья
- Сериалы
- Спорт
- Стиль жизни
- ТВ передачи
- Танцы
- Технологии
- Товары
- Ужасы
- Фильмы
- Шоу-бизнес
- Юмор
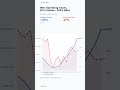
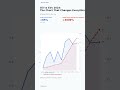
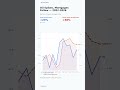
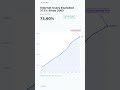
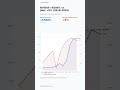
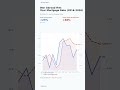
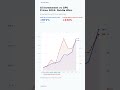
Home Prices vs. Wages: Two Economies Since 2016
This chart reveals one of the most alarming economic splits of the past decade: US home prices rose nearly 79% since 2016, while average hourly wages grew only 43%. The Case-Shiller Home Price Index and average hourly earnings data tell two completely different stories on the same graph. The divergence exploded between 2020 and 2022, when pandemic-era demand, record-low interest rates, and institutional investor buying pushed housing costs into a stratosphere wages couldn't reach. For everyday workers, this means homeownership is slipping further out of reach every year. The wealth gap between homeowners and renters keeps widening. This is the data behind the political debate — and it hits different when you see both lines on one chart. #HousingCrisis #WageGap #HomePrices #Economy #PersonalFinance #RealEstate #WallStreet #CostOfLiving
🎙️ Voice powered by ElevenLabs AI | https://elevenlabs.io?from=theplottwist
#theplottwist #dataviz #charts #datavisualization #didyouknow
Видео Home Prices vs. Wages: Two Economies Since 2016 канала The Plot Twist
🎙️ Voice powered by ElevenLabs AI | https://elevenlabs.io?from=theplottwist
#theplottwist #dataviz #charts #datavisualization #didyouknow
Видео Home Prices vs. Wages: Two Economies Since 2016 канала The Plot Twist
Комментарии отсутствуют
Информация о видео
2 марта 2026 г. 11:36:24
00:00:42
Другие видео канала