How to build Line charts in Tableau | Tableau Charts
Line charts are very easy in Tableau, but sometimes, you might find yourself fighting with the automated capabilities of Tableau. In this video, I explain how to draw a line chart and how to control discrete and continuous fields, so you fully understand why the axis behaves the way it does.
Join this channel to get access to perks:
https://www.youtube.com/channel/UC7HYxRWmaNlJux-X7rNLZyw/join
#tableau #salesforce #analytics #data
Follow me on Twitter: https://twitter.com/TableauTim
My recording gear & what's on my desk. https://kit.co/TableauTim/desk-setup
My website: https://www.tableautim.com/
My Screen Annotation Tool: https://j.mp/3HWc4Mj
My technology Channel: https://j.mp/3F0d28f
Share feedback and Suggestions: https://tableautim.canny.io/suggestions ----------
(C) 2023 TN-Media LTD. No re-use, unauthorized use, or redistribution, of this video without prior permission.
Видео How to build Line charts in Tableau | Tableau Charts канала Tableau Tim
Показать
Комментарии отсутствуют
Информация о видео
Другие видео канала
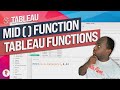 The MID Function in Tableau.
 Tableau Conference 2017 Las Vegas @ Mandalay Bay
 Include Level of Detail Calculation: Tableau Functions
 Tableau Public Search - Find Tableau inspiration for anything.
 Replay animations: New in Tableau 2021.4
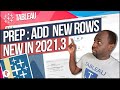 Generate Rows in Tableau Prep : New in tableau 2021.3
 Analytics Extensions Explained with Aidan Moore | Data Science in Tableau & more
 Let end users show and hide filters and more with this extension | What's new Tableau 2022.3
 Revealing the Future: AI's Impact on Data Analysts with Rahul Trehan - ChatGPT & AutoGPT
 Ask data updates in Tableau Server & Tableau Cloud: New in 2021.3
 How to do Dashed & Dotted Lines in Tableau | Line Patterns - New in tableau 2023.2
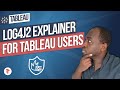 Apache Log4J2 explained for Tableau users
 Tableau Developer tools: New in Tableau 2022.1 with Andre De Vries
 Tableau Pulse - Metrics Unleashed | Announced at Tableau Conference 2023
 Google Analytics 4 Connector for Tableau | New in Tableau
 Tableau Visionary unboxing and thanks!
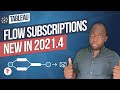 Subscription emails for flow completion: New in tableau 2021.4
 Getting started with Snowflake PT-3: Running queries and using JSON
 Unified notification experience
 Re-watch all of 2021, 2020 & 2019 conference on demand