- Популярные видео
- Авто
- Видео-блоги
- ДТП, аварии
- Для маленьких
- Еда, напитки
- Животные
- Закон и право
- Знаменитости
- Игры
- Искусство
- Комедии
- Красота, мода
- Кулинария, рецепты
- Люди
- Мото
- Музыка
- Мультфильмы
- Наука, технологии
- Новости
- Образование
- Политика
- Праздники
- Приколы
- Природа
- Происшествия
- Путешествия
- Развлечения
- Ржач
- Семья
- Сериалы
- Спорт
- Стиль жизни
- ТВ передачи
- Танцы
- Технологии
- Товары
- Ужасы
- Фильмы
- Шоу-бизнес
- Юмор
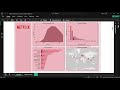
Unlocking Sales Performance: Interactive Sales Analytics Dashboard in Power BI
In this video, I walk through my latest data visualization project: a highly interactive Sales Performance Dashboard built in Power BI.
Whether you are a business analyst or a data enthusiast, this project provides a deep dive into company sales, profit margins, and regional performance, showcasing how to turn raw transactional data into actionable business insights.
--- 📊 What’s Inside the Dashboard? ---
In this analysis, I explored:
* Sales Performance: Tracking total sales value, order trends, and revenue growth over time.
* Product Line Analysis: Identifying top-performing product categories (e.g., Vintage Cars, Classic Cars) by quantity and profit.
* Geographic Insights: Visualizing the customer and office footprint across different countries and cities.
* Profitability Metrics: Breaking down the relationship between buyPrice, priceEach, and actual profit margins to understand business health.
--- ⚙️ Technical Process & Methodology ---
Managing this dataset required a rigorous approach to data modeling and analysis:
* Data Cleaning & Integration: I processed the raw sales dataset to ensure data integrity, handling variables such as sales_value and cost_of_sales to perform accurate margin calculations.
* Data Modeling: I structured the data to allow for seamless cross-filtering between dimensions like product lines, order dates, and customer geography.
* DAX & Analysis: I utilized DAX measures to calculate key business metrics, including total profit, quantity ordered, and year-over-year sales comparisons, creating a highly dynamic and responsive dashboard experience.
--- 🚀 Tools Used ---
* Power BI Desktop: For advanced data modeling, DAX formula development, and interactive report visualization.
* Data Source: Local dataset
--- 🔗 Get Involved ---
View the Project: https://github.com/Shubhranshu331/Data-Analytics/tree/main/Cassic%20model
Let’s Connect: I’d love to hear your feedback on the layout or the insights I’ve uncovered! Feel free to drop a comment below or connect with me on https://www.linkedin.com/in/shubhranshu489/.
#PowerBI #SalesAnalytics #DataVisualization #BusinessIntelligence #PortfolioProject #DashboardDesign #DataAnalysis
Видео Unlocking Sales Performance: Interactive Sales Analytics Dashboard in Power BI канала Shubhranshu
Whether you are a business analyst or a data enthusiast, this project provides a deep dive into company sales, profit margins, and regional performance, showcasing how to turn raw transactional data into actionable business insights.
--- 📊 What’s Inside the Dashboard? ---
In this analysis, I explored:
* Sales Performance: Tracking total sales value, order trends, and revenue growth over time.
* Product Line Analysis: Identifying top-performing product categories (e.g., Vintage Cars, Classic Cars) by quantity and profit.
* Geographic Insights: Visualizing the customer and office footprint across different countries and cities.
* Profitability Metrics: Breaking down the relationship between buyPrice, priceEach, and actual profit margins to understand business health.
--- ⚙️ Technical Process & Methodology ---
Managing this dataset required a rigorous approach to data modeling and analysis:
* Data Cleaning & Integration: I processed the raw sales dataset to ensure data integrity, handling variables such as sales_value and cost_of_sales to perform accurate margin calculations.
* Data Modeling: I structured the data to allow for seamless cross-filtering between dimensions like product lines, order dates, and customer geography.
* DAX & Analysis: I utilized DAX measures to calculate key business metrics, including total profit, quantity ordered, and year-over-year sales comparisons, creating a highly dynamic and responsive dashboard experience.
--- 🚀 Tools Used ---
* Power BI Desktop: For advanced data modeling, DAX formula development, and interactive report visualization.
* Data Source: Local dataset
--- 🔗 Get Involved ---
View the Project: https://github.com/Shubhranshu331/Data-Analytics/tree/main/Cassic%20model
Let’s Connect: I’d love to hear your feedback on the layout or the insights I’ve uncovered! Feel free to drop a comment below or connect with me on https://www.linkedin.com/in/shubhranshu489/.
#PowerBI #SalesAnalytics #DataVisualization #BusinessIntelligence #PortfolioProject #DashboardDesign #DataAnalysis
Видео Unlocking Sales Performance: Interactive Sales Analytics Dashboard in Power BI канала Shubhranshu
Комментарии отсутствуют
Информация о видео
Вчера, 9:00:42
00:00:54
Другие видео канала