Become An Expert On Candlesticks In 3 Minutes
Learn more at http://www.dittotrade.com/
Candlesticks
Hello and Welcome to the ditto educational series that will provide you with the skills you need to become a forex trader!
This video is the beginners guide to candlesticks and will explain fundamentally what a candlestick is and what its properties are!
Candlestick charts are the more commonly used amongst forex traders because visually they provide more clear information regarding price movement within your specified time frame.
bar charts and line charts are more simple and less used but do have their value none the less.
Trading forex using candlestick charts is an essential skill to learn as a forex trader and is applicable to all currency pairs.
candlesticks can help to inform a trader’s decision making based on the information they provide. they can help us determine trends, entries, reversals and much more as your knowledge on the subject grows.
There are three parts that make up a candlestick! the open price, the closing price, and the wicks or shadows as they are sometimes referred to.
The candlestick will turn green or red to signify upwards or downwards movements known as bullish or bearish movements, but the colours may be different in your chart settings. The colours you choose do not matter as long as you know which are which.
Whatever time frame you have selected on your chart will mean each candle stick presented within that time frame represents the same amount of time that has elapsed to form that candle. Here we see 4 hour time frame is selected so all these candles represent 4 hours of each! the opening price is the first price traded for that timeframe and the closing price is the last price traded for the selected time frame.
To reiterate The open price depicts the first traded price during the formation of a new candle within its respective time frame.
The Closing price is the last price traded during the formation of the candle.
The High price is The top of the upper wick and If there is no upper wick, then the high price is the open price of a bearish candle or the closing price of a bullish candle.
The Low price would be the opposite And is the bottom of the lower wick. Again if there is no lower wick, then the low price is the open price of a bullish candle or the closing price of a bearish candle.
So how do we trade using candlesticks?
Candlesticks over the years have been well documented to behave or form a certain way when the Price is preparing to move!
There are a number of recognisable and well documented candlestick formations that indicate different scenarios which are likely to play out.
In forex we are always looking for high probability trades to remain consistently profitable putting our selves in the least amount of risk, using these candlestick formations is one amongst many confirmations you should use to enter your high probability trades but never use just one indication of movement to enter. Like a detective you must gather many clues to have conviction in you trades and what is about to occur!
Candlesticks individually form candle formations such as the spinning top, doji, hanging man, the hammer, shooting star, and many more some with name variations on the same formation. each formation have properties that indicate different possibilities at what the market may do next, we will look at that in our next more advanced candlestick video.
candlesticks when grouped together can also form various price patterns like double tops, triangles, wedges and head and shoulders patterns.
And Again These patterns will be discussed in a more advanced video but I wanted you to know of their existence so you may look at single candlestick formations and pattern formations on your charts to see how the market behaves around them.
So why don’t you open up your charts at home and and start to study what you have learned today in this video and take some time to contemplate, Contemplation is the key to learning, have a good day!
Видео Become An Expert On Candlesticks In 3 Minutes канала Ditto Trade
Показать
Комментарии отсутствуют
Информация о видео
Другие видео канала
 The Ultimate Candlestick Patterns Trading Course (For Beginners)
 Why CandleStick Wicks Are So Important! ❗✅
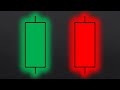 The ULTIMATE Beginner's Guide to CANDLESTICK PATTERNS
 Master The Support and Resistance Trading Strategy: ALL YOU NEED TO KNOW!
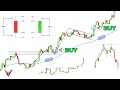 The Only Technical Analysis Video You Will Ever Need... (Full Course: Beginner To Advanced)
 Complete Candlestick Patterns Trading Course
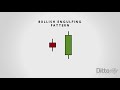 Become An Expert On Candlesticks In 5 Minutes Part 2
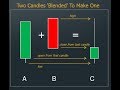 Candlestick Math - A New Way Of Using Candlesticks
 Moving Average Trading Secrets (This is What You Must Know...)
 Become An Expert On Candlesticks In 6 Minutes Part 3
 How To Read CandleStick Charts (for Beginner Technical Analysis)
 Candlestick trading Wick over Wick Zones
 Candlestick Construction
 BASIC CANDLESTICKS PATTERN TAGALOG: Magbasa ng Candlestick Pattern Tagalog: Doji Candle Tagalog
 WHY UNDERSTANDING WICKS IN TRADING IS THE MOST IMPORTANT **FOREX-STOCKS-CRYPTOCURRENCY**
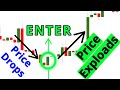 Candlestick Chart Secrets (DO NOT TRADE WITHOUT KNOWING THIS PATTERN)
 How to Read Candlestick Charts
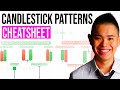 Candlestick Patterns Cheat Sheet (95% Of Traders Don't Know This)
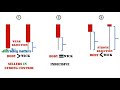 PART 8 UNDERSTANDING CANDLESTICK WICKS
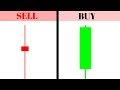 WHY YOU NEED TO UNDERSTAND PRICE ACTION WHEN TRADING **FOREX-STOCKS-CRYPTOCURRENCY**