Basic Excel Business Analytics #56: Forecasting with Linear Regression: Trend & Seasonal Pattern
Download files: https://people.highline.edu/mgirvin/AllClasses/348/348/AllFilesBI348Analytics.htm
Learn:
1) (00:11) Forecasting using Regression when we see a trend and belief the trend will extend into the future. Will will predict outside the Experimental Region with the Assumption is that trend continues into future.
2) (00:53) Forecast a Trend using Simple Liner Regression. We use the Data Analysis Regression Feature.
3) (03:22) Learn how to use FORECAST function.
4) (08:57) Forecast a Seasonal Pattern using Multiple Regression and three Categorical Variables for quarter using Multiple Linear Regression. We use the Data Analysis Regression Feature.
5) (12:12) VLOOKUP & MATCH functions with Mixed Cell References to populate new categorical variable columns with the Boolean ones and zeroes.
6) (19:53) Forecast a Trend with a Seasonal Pattern using Multiple Regression and three Categorical Variables for quarter and one quantitative variable using Multiple Linear Regression. We use the Data Analysis Regression Feature.
7)
Download Excel File Not: After clicking on link, Use Ctrl + F (Find) and search for “Highline BI 348 Class” or for the file name as seen at the beginning of the video.
Видео Basic Excel Business Analytics #56: Forecasting with Linear Regression: Trend & Seasonal Pattern канала ExcelIsFun
Показать
Комментарии отсутствуют
Информация о видео
Другие видео канала
 Forecasting in Excel using Linear Regression
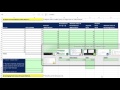 Basic Excel Business Analytics #54: Basic Forecasting Methods & Measures of Forecast Error
 Forecasting Trend and Seasonality
 Seasonality and Trend Forecasting using Multiple Linear Regression with Dummy Variables as Seasons
 Forecasting Methods made simple - Seasonal Indices
 Excel Basics - Linear Regression - Finding Slope & Y Intercept
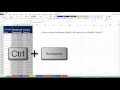 Basic Excel Business Analytics #44: Intro To Linear Regression & Scatter Chart
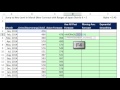 Basic Excel Business Analytics #55: Summary of 4 Basic Forecasting Methods & Mean Square Error
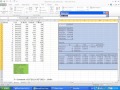 Using Multiple Regression in Excel for Predictive Analysis
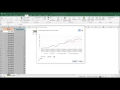 FORECAST.ETS Function (Exponential Triple Smoothing) in Excel
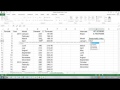 Operations Management using Excel: Seasonality and Trend Forecasting
 How to Forecast with Excel Chart Trendlines
 Basic Excel Business Analytics #57: Intro To Linear Programming using Algebra, Pencil & Paper
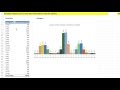 Basic Excel Business Analytics #16: Count Transactions by Hour Report & Chart
 Excel Basics 1: Introduction To Excel 1: Formatting, Formulas, Cell References, Page Setup
 Excel Data Analysis Class 01: PivotTables, Power Query, Formulas and Charts
 Forecasting in Excel Using Simple Linear Regression
 Excel Business Analytics #39: Import Related Tables: Power Query Merge? Data Model Relationships?
 Forecasting in Excel Tutorial: Forecast Sheet and Functions (SLOPE, INTERCEPT, FORECAST.LINEAR)
 How to Calculate Total Daily Averages with Pivot Tables