TABLEAU RADIAL PIE GAUGE CHART TUTORIAL
Get Tableau Certified, guaranteed - https://www.artofvisualization.com/
Learn how to make Radial Pie Gauge Chart in Tableau through this amazing tutorial!
Radial pie gauge charts look great and can be used to compare a metric or even display the target completion for key indicators.
During this tutorial, we display the responses from the 2017 Kaggle Machine Learning survey and look specifically at the preferred Machine Learning and Data Science languages used.
Видео TABLEAU RADIAL PIE GAUGE CHART TUTORIAL канала Art of Visualization
Показать
Комментарии отсутствуют
Информация о видео
Другие видео канала
 TABLEAU RADIAL BAR CHART TUTORIAL
 Tableau Mini Tutorial: Radial Bar Chart
 Tableau gauge chart| Tableau custom charts| Speedometer in Tableau
 How to Create a Pie Chart Drill Down
 How to Create Waffle Charts in Tableau
 TABLEAU DONUT CHART TUTORIAL
 Tableau Zen Master Tips & Tricks - Charts Edition
 Tableau Quick Tip - Thermometer Charts
 SUNBURST CHART TABLEAU TUTORIAL PART 1
 Creación de Gráficos en Excel #9 - Gráficos radiales
 How to Create a Radial Bar Chart and Re-use as Chart Template
 SANKEY DIAGRAM TABLEAU
 TABLEAU BUTTERFLY CHART TUTORIAL
 Tableau with Music / Creating a Radial Bar Chart
![Tableau Dashboard Tips [Top 10 Tableau Dashboard Design Tips]](https://i.ytimg.com/vi/Lu0jrymqOGM/default.jpg) Tableau Dashboard Tips [Top 10 Tableau Dashboard Design Tips]
Tableau Dashboard Tips [Top 10 Tableau Dashboard Design Tips] Radial Bar charts in Tableau using Table Calculations
 Sales Funnel Dashboard in Tableau
 Chartbusters: Gauge Chart in Tableau
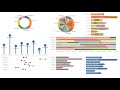 Tableau - Más alla de MOSTRARME (VIDEO1-El borde/límite)