Measuring Bode/Control Loop Response of a Power Supply
This explains how to use an oscilloscope equipped with control loop response measurement capability to measure the frequency response (Bode Plot) of a power supply control loop.
A Bode plot is graph of the frequency response of a system, characterizing gain and phase shift across different frequencies.
A modulating signal is injected into the feedback loop. The modulating signal and the output of the control loop can then be ratioed to calculate gain and compared in time to find phase.
Source:
· Arbitrary/Function Generator (built into 6 Series MSO)
· Picotest J2101A Injection Transformer
Measure:
· 6 Series MSO Oscilloscope
For more information visit: https://www.tek.com/oscilloscope/6-series-mso-mixed-signal-oscilloscope
Videos recorded by:
Tony Ambrose, Application Engineer, Tektronix
Steve Sandler, Founder, and CEO of https://www.picotest.com/
Видео Measuring Bode/Control Loop Response of a Power Supply канала Tektronix
Показать
Комментарии отсутствуют
Информация о видео
Другие видео канала
 2 Series MSO Mixed Signal Oscilloscope – Integrated Arbitrary Function Generator (Chapter 4)
 Electronic Warfare Simulation using Arbitrary Waveform Generator AWG70000
 Using the Keithley KickStart Battery Simulator App
 On Fridays We Conga
 Solutions for Emerging OIF-CEI and IEEE PAM4 Stds
 Compliance audits don't have to be scary
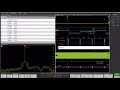 Time Correlated, Multi-Channel Analog/Digital/RF Signal Analysis Workshop
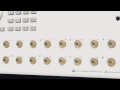 New 8 Channel AWG
 Watch us put our Spectrum Analyzers through some real-time extreme testing
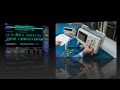 Everyday Design and Debug with an MDO3000 I Multi-Domain Analysis I Tektronix
 Tektronix Battery Simulator Helps Nowi Drive Towards Autonomous Energy
 Troubleshooting the New IEEE 802.3ck Ethernet Standard
 Keithley KickStart Software Table Tools Overview
 Evolution of the Tektronix Touchscreen Oscilloscope
 Total Product Protection
 適合現在和未來的 5 系列 B MSO 效能
 700 mΩ Active 2-Port Impedance Measurements
 Chalmers Formula Student Story
 Full Featured Spectrum Analyzer Power in Your Hand
 Fast Spectrum Sweeps with a Realtime Spectrum Analyzer
 Tips and Techniques for Setting up Your Tektronix 4/5/6 Series MSO Display