- Популярные видео
- Авто
- Видео-блоги
- ДТП, аварии
- Для маленьких
- Еда, напитки
- Животные
- Закон и право
- Знаменитости
- Игры
- Искусство
- Комедии
- Красота, мода
- Кулинария, рецепты
- Люди
- Мото
- Музыка
- Мультфильмы
- Наука, технологии
- Новости
- Образование
- Политика
- Праздники
- Приколы
- Природа
- Происшествия
- Путешествия
- Развлечения
- Ржач
- Семья
- Сериалы
- Спорт
- Стиль жизни
- ТВ передачи
- Танцы
- Технологии
- Товары
- Ужасы
- Фильмы
- Шоу-бизнес
- Юмор
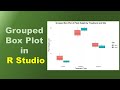
Multiple-Grouped Bar Chart with Standard Deviation | OriginPro | OriginPro Graph
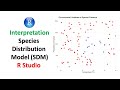
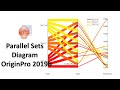
In this video tutorial, I will show you How to Draw a Multiple-Grouped Bar Chart with Standard Deviation by using the Origin Pro.
Software Version : OriginPro 2022
Disclaimer
This video is made for the sole purpose of higher education. Care is taken to provide the most accurate information. However, we can’t guarantee the accuracy of all the information in this video. Kindly do your own research before coming to any conclusions or making any decisions.
#biostatistics #statistics #dataanalysis #statisticalanalysis
#datavisualization #datascience #dataanalytics #datamining #origin #originlab #originpro #bargraph #barcharts #standard_deviation
Playlists:
OriginPro : https://youtube.com/playlist?list=PLFJORbwscllCbmfwn1bVuKqOMvDf2aves
Past: https://youtube.com/playlist?list=PLFJORbwscllAXNjaSuhi8XY38hMcXmtI3
GrapPad Prism: https://youtube.com/playlist?list=PLFJORbwscllCIh8MF2c-D0pQupPSPIxXj
SPSS: https://youtube.com/playlist?list=PLFJORbwscllCKd56sq2z8KUnyvYSqN6rZ
Excel: https://youtube.com/playlist?list=PLFJORbwscllAI8VQ8AgGRzIDWMgnsFTKA
BioDiversity Pro: https://youtube.com/playlist?list=PLFJORbwscllBR_SoGBAyZz6EFtdULhffo
Minitab: https://youtube.com/playlist?list=PLFJORbwscllDt3KH9s6yBZO_WPGbATicP
Follow me:
Join this YouTube channel membership:
https://www.youtube.com/channel/UCnp14HZrZllBJBhfCaLut0Q/join
Telegram: https://t.me/statistics_bio7
Instagram: https://www.instagram.com/statisticsbio7/
Facebook Page: https://www.facebook.com/statisticsbio7/
Видео Multiple-Grouped Bar Chart with Standard Deviation | OriginPro | OriginPro Graph канала Statistics Bio7
Multiple-grouped bar chart Standard deviation in OriginPro OriginPro tutorial Data visualization Graphing in OriginPro Visualizing data in OriginPro Creating bar charts with standard deviation standard deviation bar chart with standard deviation originpro standard error graphs in originpro bar chart in origin chart error bars of standard deviation how to draw error bars in origin how to add error bars in origin graph how to plot error bars in origin standard error
Комментарии отсутствуют
Информация о видео
21 февраля 2024 г. 17:30:41
00:12:16
Другие видео канала