Analyzing Data for Investigative Reporting using Excel Pivot Tables
Excel's "Pivot Table" function can be powerful tool to run descriptive statics and show trends. It's also nice for those who prefer to interact with data visually. ICIJ reporter Kate Willson demonstrates the tool in action.
Видео Analyzing Data for Investigative Reporting using Excel Pivot Tables канала ICIJ
Видео Analyzing Data for Investigative Reporting using Excel Pivot Tables канала ICIJ
Показать
Комментарии отсутствуют
Информация о видео
Другие видео канала
 Why join the Implant Files investigation? | Implant Files
 Deforestation Inc.: Teak trade props up Myanmar military regime
 Everyone Cheated, Then France Came Clean
 How the Panama Papers rocked pop culture
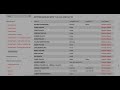 How to use ICIJ's Offshore Leaks Database (part 2)
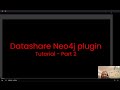 ICIJ's Datashare Neo4j Plug-in Tutorial - Part 2
 Standing together for press freedom on World Press Freedom Day
 Mail from a tax haven: Offshore Leaks in Finland
 SXSW Online 2021 - Flawed Finance: Collaborative Journalism Exposes Global Finance’s Inequities
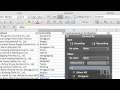 Filter and Sort in Excel for Investigative Reporting
 How to use ICIJ's Offshore Leaks Database (part 3)
 How to search companies on Lexis for investigative journalism: ICIJ
 'Staying silent does not honor the pain of the people.'
 The 30-year fight for breast implant safety
 How to use the International Medical Device Database | Implant FIles
 Hake Hoax: Fish in Spain Not Always What the Label Says
 Looting the Seas: the Bluefin Tuna Black Market
 ICIJ's Datashare Neo4j Plug-in Tutorial - Part 1
 France 24: Pierre Romera
 Evicted & Abandoned: Investigating World Bank resettlement failures