How to: Plot a Function in Python
Learn how to define a function and plot it in Python.
Script can be found here: https://www.hageslab.com/Resources.html#PythonAnchor
Here we are using "Spyder" IDE with the numpy and matplotlib libraries
Useful resources:
https://matplotlib.org/tutorials/text/mathtext.html
https://matplotlib.org/
https://matplotlib.org/3.3.3/api/_as_gen/matplotlib.pyplot.plot.html#matplotlib.pyplot.plot
Script:
import numpy as np
import matplotlib.pyplot as plt
def f(x,a,b,c):
return a*x**2+b*x+c
xlist = np.linspace(-10,10,num=1000)
# xlist = np.arange(-10,10.1,.1)
a=5
b=1
c=4
ylist = f(xlist,a,b,c)
plt.figure(num=0,dpi=120)
plt.plot(xlist,ylist,label="f(x)")
plt.plot(xlist,ylist**(1/2),'--g',label=r"f(x)$^{0.5}$")
plt.title("Plotting Example")
plt.xlabel("Distance / ft")
plt.ylabel("Height / ft")
plt.legend()
Видео How to: Plot a Function in Python канала HagesLab
Показать
Комментарии отсутствуют
Информация о видео
Другие видео канала
![Fin Equation General Solution - Lecture 2 [Heat / Energy Transfer]](https://i.ytimg.com/vi/8JQ_FOWGjoI/default.jpg) Fin Equation General Solution - Lecture 2 [Heat / Energy Transfer]
Fin Equation General Solution - Lecture 2 [Heat / Energy Transfer]![Adiabatic Fin Tip Solution - Lecture 5 [Heat / Energy Transfer]](https://i.ytimg.com/vi/wxCHDlZQ35A/default.jpg) Adiabatic Fin Tip Solution - Lecture 5 [Heat / Energy Transfer]
Adiabatic Fin Tip Solution - Lecture 5 [Heat / Energy Transfer] Chalcogenide Perovskite Nanoparticles "Flash Talk" | Faraday Discussion 2022 | Chuck Hages (UF)
 Machine Learning for Analysis of TRPL Data | EMRS 2022 | Chuck Hages (UF)
 Root Finding: Brute Force
![Fin Effectiveness - Lecture 7 [Heat / Energy Transfer]](https://i.ytimg.com/vi/t3LBqXLu6gM/default.jpg) Fin Effectiveness - Lecture 7 [Heat / Energy Transfer]
Fin Effectiveness - Lecture 7 [Heat / Energy Transfer]![Infinite Fin Solution - Lecture 4 [Heat / Energy Transfer]](https://i.ytimg.com/vi/QjrbJBfuduw/default.jpg) Infinite Fin Solution - Lecture 4 [Heat / Energy Transfer]
Infinite Fin Solution - Lecture 4 [Heat / Energy Transfer] Kronig-Penny Solution in Python
 Leibniz Approximation of Pi
![Convection Fin Tip Solution - Lecture 6 [Heat / Energy Transfer]](https://i.ytimg.com/vi/0JdqNTtR3ec/default.jpg) Convection Fin Tip Solution - Lecture 6 [Heat / Energy Transfer]
Convection Fin Tip Solution - Lecture 6 [Heat / Energy Transfer]![Fin Energy Balance - Lecture 1 [Heat / Energy Transfer]](https://i.ytimg.com/vi/LWRaEeM92L0/default.jpg) Fin Energy Balance - Lecture 1 [Heat / Energy Transfer]
Fin Energy Balance - Lecture 1 [Heat / Energy Transfer]![Fin Boundary Conditions - Lecture 3 [Heat / Energy Transfer]](https://i.ytimg.com/vi/LlJdw2g02uU/default.jpg) Fin Boundary Conditions - Lecture 3 [Heat / Energy Transfer]
Fin Boundary Conditions - Lecture 3 [Heat / Energy Transfer] Root Finding: Bisection Method
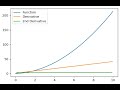 How to: Numerical Derivative in Python
 How to: Import, Plot, Fit, and Integrate Data in Python
 How to: Solve an ODE in Python (Boundary Value Problem)
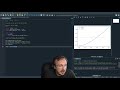 Root Finding in Python
 How to: Make a Polar Plot in Python
 Fermi-Dirac Integral (Semiconductors): Derivation and Python Plotting
 How to Give an Effective Scientific Presentation | Chuck Hages (UF)