- Популярные видео
- Авто
- Видео-блоги
- ДТП, аварии
- Для маленьких
- Еда, напитки
- Животные
- Закон и право
- Знаменитости
- Игры
- Искусство
- Комедии
- Красота, мода
- Кулинария, рецепты
- Люди
- Мото
- Музыка
- Мультфильмы
- Наука, технологии
- Новости
- Образование
- Политика
- Праздники
- Приколы
- Природа
- Происшествия
- Путешествия
- Развлечения
- Ржач
- Семья
- Сериалы
- Спорт
- Стиль жизни
- ТВ передачи
- Танцы
- Технологии
- Товары
- Ужасы
- Фильмы
- Шоу-бизнес
- Юмор
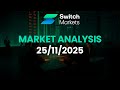
How To Use The FREE Trading Heat Map In Under 7 Minutes! - Switch Markets
Use the FREE Market Heat Map today! → https://www.switchmarkets.com/tools/market-heat-map
In this video, we walk you through the custom market heatmap tool available for free on the Switch Markets website. This powerful trading tool, available now on the Switch Markets website, allows you to visualize real time market data to identify which assets are driving the most volume and liquidity across the global markets.
Whether you are trading stocks, forex, commodities, or crypto, our market heatmap gives you an instant visual representation of asset performance. You will learn how to spot high volume assets, identify strong trends, and see where the liquidity is flowing without needing complex charts or paid subscriptions. This tool is designed to help traders of all levels make faster, data driven decisions by highlighting the strongest and weakest instruments in real time.
What you will learn in this video:
How to access and navigate the free Switch Markets market heatmap
Filtering real time data for forex pairs, cryptocurrencies, and stock indices
Understanding color coded volume and liquidity indicators
Using the heatmap to spot volatility and potential trade setups
Analyzing market sentiment across different timeframes
About the Switch Markets Heatmap:
Our custom tool aggregates live market data to show you exactly what is moving. Instead of scanning dozens of individual charts, you can use this heatmap to see the entire market landscape at a glance. It covers a wide range of assets including major and exotic forex pairs, global stock indices, and popular cryptocurrencies. The tool helps you cut through the noise and focus on assets with the highest trading activity and potential opportunities.
If you found this walkthrough helpful, please subscribe to the channel for more tutorials on using professional trading tools to improve your strategy. Leave a comment below if you have questions about specific assets or features you would like us to cover in the next video.
***These videos are for educational purposes only and are not financial advice. Trading involves high risk and may not be suitable for everyone. You could lose all your invested funds - only trade with money you can afford to lose. Understand the risks and seek independent advice if needed.
Видео How To Use The FREE Trading Heat Map In Under 7 Minutes! - Switch Markets канала Switch Markets
Комментарии отсутствуют
Информация о видео
20 ноября 2025 г. 21:01:37
00:06:45
Другие видео канала


![How To Trade Silver In Under 10 Minutes [XAGUSD, CFDs, Futures, ETFs & More] - Switch Markets](https://i.ytimg.com/vi/V7F5OL0be_M/default.jpg)