Churn Analysis in Excel Demonstration
Churn analysis demonstration by a former Director of Retention Analytics for the second-largest US cable company. Use my tips to do a quick, but not perfunctory analysis of your customer churn data using Excel. I analyze publicly available Kaggle telco churn dataset using pivot tables, pivot charts, VLOOKUP, and perform data visualization.
Learn how to identify variables that are associated with increased churn, how to correctly categorize your continuous variables and ways to visually present your findings.
Kaggle dataset: https://www.kaggle.com/blastchar/telco-customer-churn
My blog post that describes the process: https://zyabkina.com/churn-analysis-in-excel-telecom-example/
If you would like to improve your churn analysis skills on any platform, read my comprehensive guide. It summarizes lessons from many years of analyzing real subscriber data and will get you up to speed fast. https://zyabkina.com/churn-analysis-ultimate-guide-to-customer-attrition/
Chapters:
0:00 Kaggle telecom churn data
1:08 Data prep: churn and total customers flags
2:08 Calculate churn rate in pivot table
3:06 Churn rate split by categorical variables
3:26 Pivot chart of churn rate
4:15 Handling continuous variables
6:50 Using VLOOKUP to bring outside data
9:10 Churn visualization and reporting
Видео Churn Analysis in Excel Demonstration канала Probabilistically
Показать
Комментарии отсутствуют
Информация о видео
Другие видео канала
 Cohort Analysis on Customer Retention in Excel
 Data Exploration with Excel
 Predicting Customer Churn in R
 Customer Retention & Cohort Analysis | How VCs Calculate Customer Retention
 How to Use Cohort Analysis to Calculate Retention and Churn Rate in Excel
 The Digital Telco: Examining Trends in the Telecom Industry and Their Impact on Customers
 Customer Churn Rate: How to Calculate it and Why It Matters (#AdMath)
 Predicting User Churn for Banks - In 4 Minutes
 Excel Pivot Tables EXPLAINED in 10 Minutes (Productivity tips included!)
 Operations Management using Excel: Seasonality and Trend Forecasting
 The SaaS business model & metrics: Understand the key drivers for success
 Find Lost Customers Using Power BI and DAX
 Logistic Regression Using Excel
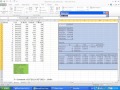 Using Multiple Regression in Excel for Predictive Analysis
 Employee Churn Prediction using Azure Machine Learning Studio | Azure ML
 Performing Customer Churn Rate Analysis in Excel
 How to Calculate Customer Lifetime Value | The #1 Most Important Metric in Ecommerce
 How to build Interactive Excel Dashboards
 How to use Excel Index Match (the right way)
 Extract Data based on a Drop-Down List selection in Excel