- Популярные видео
- Авто
- Видео-блоги
- ДТП, аварии
- Для маленьких
- Еда, напитки
- Животные
- Закон и право
- Знаменитости
- Игры
- Искусство
- Комедии
- Красота, мода
- Кулинария, рецепты
- Люди
- Мото
- Музыка
- Мультфильмы
- Наука, технологии
- Новости
- Образование
- Политика
- Праздники
- Приколы
- Природа
- Происшествия
- Путешествия
- Развлечения
- Ржач
- Семья
- Сериалы
- Спорт
- Стиль жизни
- ТВ передачи
- Танцы
- Технологии
- Товары
- Ужасы
- Фильмы
- Шоу-бизнес
- Юмор
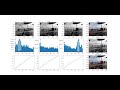
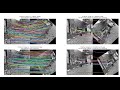
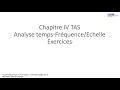
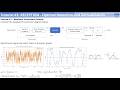
Démo Sous-Echantillonnage (Décimation) et Sur-Echantillonnage (Interpolation) + Code Python
Filtrage Multi-Cadences
Cours Exercices
https://youtu.be/jxow00T4ENA https://youtu.be/8iyyQexXzsw
https://youtu.be/_vPMzWd75_E https://youtu.be/ofOcuCwjHsc
https://youtu.be/PemI8htswXE
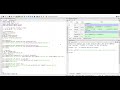
Code python
# -*- coding: utf-8 -*-
"""
Created on Thu Apr 7 16:53:18 2022
@author: AKourgli
"""
import numpy as np; import matplotlib.pyplot as plt;import scipy.signal as sp;
N = 30; f0=100; f1=300; fe=2000; Te=1/fe; NF=1024;
t = np.arange(0.0, N*Te, Te); x = np.sin(2.0*np.pi*f0*t) + np.sin(2.0*np.pi*f1*t) ;
TFx = np.fft.fft(x,NF); TFx = np.fft.fftshift(TFx); freq = np.arange(-NF/2,NF/2)*fe/NF;
plt.figure(1)
plt.subplot(321); plt.stem(t, x); plt.subplot(322); plt.plot(freq, np.abs(TFx));
x1 = np.zeros(2*N); x1[::2]=x[::] ;t1 = np.arange(0.0, N*Te, Te/2); TFx1 = np.fft.fft(x1,NF);
TFx1 = np.fft.fftshift(TFx1); freq = np.arange(-NF/2,NF/2)*2*fe/NF;
plt.subplot(323); plt.stem(t1, x1); plt.subplot(324); plt.plot(freq, np.abs(TFx1));
x2 = np.zeros(4*N); x2[::4]=x[::] ;t2 = np.arange(0.0, N*Te, Te/4); TFx2 = np.fft.fft(x2,NF);
TFx2 = np.fft.fftshift(TFx2); freq = np.arange(-NF/2,NF/2)*4*fe/NF;
plt.subplot(325); plt.stem(t2, x2); plt.subplot(326); plt.plot(freq, np.abs(TFx2));
plt.figure(2)
freq = np.arange(-NF/2,NF/2)*fe/NF;
plt.subplot(321); plt.stem(t, x); plt.subplot(322); plt.plot(freq, np.abs(TFx));
x1 = sp.resample(x,2*N); t1 = np.arange(0.0, N*Te, Te/2); TFx1 = np.fft.fft(x1,NF);
TFx1 = np.fft.fftshift(TFx1); freq = np.arange(-NF/2,NF/2)*2*fe/NF;
plt.subplot(323); plt.stem(t1, x1); plt.subplot(324); plt.plot(freq, np.abs(TFx1));
x2 = sp.resample(x,4*N); t2 = np.arange(0.0, N*Te, Te/4); TFx2 = np.fft.fft(x2,NF);
TFx2 = np.fft.fftshift(TFx2); freq = np.arange(-NF/2,NF/2)*4*fe/NF;
plt.subplot(325); plt.stem(t2, x2); plt.subplot(326); plt.plot(freq, np.abs(TFx2));
N = 100; f0=100; f1=300; fe=2000; Te=1/fe; NF=1024;
t = np.arange(0.0, N*Te, Te); x = np.sin(2.0*np.pi*f0*t) + np.sin(2.0*np.pi*f1*t) ;
TFx = np.fft.fft(x,NF); TFx = np.fft.fftshift(TFx); freq = np.arange(-NF/2,NF/2)*fe/NF;
plt.figure(3)
plt.subplot(321); plt.stem(t, x); plt.subplot(322); plt.plot(freq, np.abs(TFx));
x1 = x[::2]; t1 = t[::2]; TFx1 = np.fft.fft(x1,NF); TFx1 = np.fft.fftshift(TFx1);
freq = np.arange(-NF/2,NF/2)*fe/(2*NF);
plt.subplot(323); plt.stem(t1, x1); plt.subplot(324); plt.plot(freq, np.abs(TFx1));
x2 = x[::6]; t2 = t[::6]; TFx2 = np.fft.fft(x2,NF); TFx2 = np.fft.fftshift(TFx2);
freq = np.arange(-NF/2,NF/2)*fe/(6*NF);
plt.subplot(325); plt.stem(t2, x2); plt.subplot(326); plt.plot(freq, np.abs(TFx2));
plt.figure(4)
freq = np.arange(-NF/2,NF/2)*fe/NF;
plt.subplot(321); plt.stem(t, x); plt.subplot(322); plt.plot(freq, np.abs(TFx));
x1 = sp.decimate(x,2); t1 = t[::2]; TFx1 = np.fft.fft(x1,NF); TFx1 = np.fft.fftshift(TFx1);
freq = np.arange(-NF/2,NF/2)*fe/(2*NF);
plt.subplot(323); plt.stem(t1, x1); plt.subplot(324); plt.plot(freq, np.abs(TFx1));
x2 = sp.decimate(x,6); t2 = t[::6]; TFx2 = np.fft.fft(x2,NF); TFx2 = np.fft.fftshift(TFx2);
freq = np.arange(-NF/2,NF/2)*fe/(6*NF);
plt.subplot(325); plt.stem(t2, x2); plt.subplot(326); plt.plot(freq, np.abs(TFx2));
# from PIL import Image
# img = Image.open('bez.jpg')
# L,C= img.size;
# img_resize = img.resize((L/2, C/2))
# img_resize.show()
# img_resize.save('bez_resize_nearest.jpg')
# img_resize_lanczos = img.resize((L/2, C/2), Image.LANCZOS)
# img_resize_lanczos.save('bez_resize_lanczos.jpg')
Видео Démo Sous-Echantillonnage (Décimation) et Sur-Echantillonnage (Interpolation) + Code Python канала Assia Kourgli
Cours Exercices
https://youtu.be/jxow00T4ENA https://youtu.be/8iyyQexXzsw
https://youtu.be/_vPMzWd75_E https://youtu.be/ofOcuCwjHsc
https://youtu.be/PemI8htswXE
Code python
# -*- coding: utf-8 -*-
"""
Created on Thu Apr 7 16:53:18 2022
@author: AKourgli
"""
import numpy as np; import matplotlib.pyplot as plt;import scipy.signal as sp;
N = 30; f0=100; f1=300; fe=2000; Te=1/fe; NF=1024;
t = np.arange(0.0, N*Te, Te); x = np.sin(2.0*np.pi*f0*t) + np.sin(2.0*np.pi*f1*t) ;
TFx = np.fft.fft(x,NF); TFx = np.fft.fftshift(TFx); freq = np.arange(-NF/2,NF/2)*fe/NF;
plt.figure(1)
plt.subplot(321); plt.stem(t, x); plt.subplot(322); plt.plot(freq, np.abs(TFx));
x1 = np.zeros(2*N); x1[::2]=x[::] ;t1 = np.arange(0.0, N*Te, Te/2); TFx1 = np.fft.fft(x1,NF);
TFx1 = np.fft.fftshift(TFx1); freq = np.arange(-NF/2,NF/2)*2*fe/NF;
plt.subplot(323); plt.stem(t1, x1); plt.subplot(324); plt.plot(freq, np.abs(TFx1));
x2 = np.zeros(4*N); x2[::4]=x[::] ;t2 = np.arange(0.0, N*Te, Te/4); TFx2 = np.fft.fft(x2,NF);
TFx2 = np.fft.fftshift(TFx2); freq = np.arange(-NF/2,NF/2)*4*fe/NF;
plt.subplot(325); plt.stem(t2, x2); plt.subplot(326); plt.plot(freq, np.abs(TFx2));
plt.figure(2)
freq = np.arange(-NF/2,NF/2)*fe/NF;
plt.subplot(321); plt.stem(t, x); plt.subplot(322); plt.plot(freq, np.abs(TFx));
x1 = sp.resample(x,2*N); t1 = np.arange(0.0, N*Te, Te/2); TFx1 = np.fft.fft(x1,NF);
TFx1 = np.fft.fftshift(TFx1); freq = np.arange(-NF/2,NF/2)*2*fe/NF;
plt.subplot(323); plt.stem(t1, x1); plt.subplot(324); plt.plot(freq, np.abs(TFx1));
x2 = sp.resample(x,4*N); t2 = np.arange(0.0, N*Te, Te/4); TFx2 = np.fft.fft(x2,NF);
TFx2 = np.fft.fftshift(TFx2); freq = np.arange(-NF/2,NF/2)*4*fe/NF;
plt.subplot(325); plt.stem(t2, x2); plt.subplot(326); plt.plot(freq, np.abs(TFx2));
N = 100; f0=100; f1=300; fe=2000; Te=1/fe; NF=1024;
t = np.arange(0.0, N*Te, Te); x = np.sin(2.0*np.pi*f0*t) + np.sin(2.0*np.pi*f1*t) ;
TFx = np.fft.fft(x,NF); TFx = np.fft.fftshift(TFx); freq = np.arange(-NF/2,NF/2)*fe/NF;
plt.figure(3)
plt.subplot(321); plt.stem(t, x); plt.subplot(322); plt.plot(freq, np.abs(TFx));
x1 = x[::2]; t1 = t[::2]; TFx1 = np.fft.fft(x1,NF); TFx1 = np.fft.fftshift(TFx1);
freq = np.arange(-NF/2,NF/2)*fe/(2*NF);
plt.subplot(323); plt.stem(t1, x1); plt.subplot(324); plt.plot(freq, np.abs(TFx1));
x2 = x[::6]; t2 = t[::6]; TFx2 = np.fft.fft(x2,NF); TFx2 = np.fft.fftshift(TFx2);
freq = np.arange(-NF/2,NF/2)*fe/(6*NF);
plt.subplot(325); plt.stem(t2, x2); plt.subplot(326); plt.plot(freq, np.abs(TFx2));
plt.figure(4)
freq = np.arange(-NF/2,NF/2)*fe/NF;
plt.subplot(321); plt.stem(t, x); plt.subplot(322); plt.plot(freq, np.abs(TFx));
x1 = sp.decimate(x,2); t1 = t[::2]; TFx1 = np.fft.fft(x1,NF); TFx1 = np.fft.fftshift(TFx1);
freq = np.arange(-NF/2,NF/2)*fe/(2*NF);
plt.subplot(323); plt.stem(t1, x1); plt.subplot(324); plt.plot(freq, np.abs(TFx1));
x2 = sp.decimate(x,6); t2 = t[::6]; TFx2 = np.fft.fft(x2,NF); TFx2 = np.fft.fftshift(TFx2);
freq = np.arange(-NF/2,NF/2)*fe/(6*NF);
plt.subplot(325); plt.stem(t2, x2); plt.subplot(326); plt.plot(freq, np.abs(TFx2));
# from PIL import Image
# img = Image.open('bez.jpg')
# L,C= img.size;
# img_resize = img.resize((L/2, C/2))
# img_resize.show()
# img_resize.save('bez_resize_nearest.jpg')
# img_resize_lanczos = img.resize((L/2, C/2), Image.LANCZOS)
# img_resize_lanczos.save('bez_resize_lanczos.jpg')
Видео Démo Sous-Echantillonnage (Décimation) et Sur-Echantillonnage (Interpolation) + Code Python канала Assia Kourgli
Комментарии отсутствуют
Информация о видео
8 апреля 2022 г. 16:31:06
00:45:00
Другие видео канала