- Популярные видео
- Авто
- Видео-блоги
- ДТП, аварии
- Для маленьких
- Еда, напитки
- Животные
- Закон и право
- Знаменитости
- Игры
- Искусство
- Комедии
- Красота, мода
- Кулинария, рецепты
- Люди
- Мото
- Музыка
- Мультфильмы
- Наука, технологии
- Новости
- Образование
- Политика
- Праздники
- Приколы
- Природа
- Происшествия
- Путешествия
- Развлечения
- Ржач
- Семья
- Сериалы
- Спорт
- Стиль жизни
- ТВ передачи
- Танцы
- Технологии
- Товары
- Ужасы
- Фильмы
- Шоу-бизнес
- Юмор
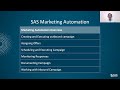
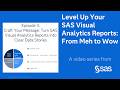
SAS Visual Analytics Report Identify Performance Bottlenecks #Shorts #SASUsers #LearnSAS
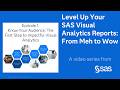
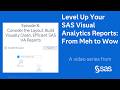
Performance problems hide in plain sight. 🚀 In this short, discover how to identify performance and usability issues in SAS Visual Analytics using built in review and diagnostic tools. Learn how testing colour, accessibility, and load performance helps you create reports that are faster, clearer, and trusted by every audience. A must know quick win for analysts and students serious about better analytics design.
Level Up Your SAS Visual Analytics Reports: https://youtube.com/playlist?list=PLnVUo3qYfz1uWGKQtedMerl_f7SuPA7lC
SUBSCRIBE TO THE SAS USERS YOUTUBE CHANNEL #SASUsers #LearnSAS
https://www.youtube.com/@SASSoftwareAsiaPacific?sub_confirmation=1
ABOUT SAS
SAS is a trusted analytics powerhouse for organizations seeking immediate value from their data. A deep bench of analytics solutions and broad industry knowledge keep our customers coming back and feeling confident. With SAS®, you can discover insights from your data and make sense of it all. Identify what’s working and fix what isn’t. Make more intelligent decisions. And drive relevant change.
CONNECT WITH SAS
SAS ► https://www.sas.com
SAS Customer Support ► https://support.sas.com
SAS Communities ► https://communities.sas.com
SAS Analytics Explorers ► https://explorers.sas.com
Facebook ► https://www.facebook.com/SASsoftware
X ► https://www.twitter.com/SASsoftware
LinkedIn ► https://www.linkedin.com/company/sas
Blogs ► https://blogs.sas.com
RSS ► https://www.sas.com/rss
Видео SAS Visual Analytics Report Identify Performance Bottlenecks #Shorts #SASUsers #LearnSAS канала SAS Users Asia Pacific
Комментарии отсутствуют
Информация о видео
25 апреля 2026 г. 19:01:32
00:00:57
Другие видео канала