Triple Bottom Chart Pattern #trading #stockmarketanalysis
Triple Bottom Chart Pattern #trading #stockmarketanalysis
A Triple Bottom is a bullish reversal chart pattern that indicates a shift from a downtrend to an uptrend. It forms when the price tests a support level three times without breaking below it, showing strong buying interest at that level.
Key Characteristics:
1. Three Lows at a Similar Level: Price touches the same support level three times, forming a clear bottom.
2. Downtrend Precedes the Pattern: It usually appears after a prolonged downtrend.
3. Breakout Confirmation: A bullish breakout occurs when the price moves above the resistance level (neckline) formed by the highs between the bottoms.
4. Volume Increase: Volume often rises during the breakout, confirming strength in buying momentum.
#trading #chartpattern #stockmarketchart #chartpattern
Видео Triple Bottom Chart Pattern #trading #stockmarketanalysis канала Share Market Guide
triple Bottom Chart Pattern, Chart pattern, Chart pattern simplify, chart pattern analysis, chart pattern for beginners, chart pattern analysis for beginners, chart analysis, chart reading, triple Bottom Chart Pattern for beginners, chart pattern k base pr trading kese kre, how to use a chart pattern, chart reading techniques, trading tips for beginners, trading tips, chart pattern trading, trading for beginners, price Action for beginners
Показать
Комментарии отсутствуют
Информация о видео
24 марта 2025 г. 10:05:49
00:00:56
Другие видео канала
 How to make money from the Stock Market #stockmarketanalysis #chartpatterns #chartpatterns
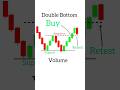 Double Bottom Chart Pattern #trading #candlestick #chart patterns #stocks
 Double Candlestick Pattern // Price Action #pushkarrajthakur #trading #candlestickpattern
 Price Action VS Indicator // Technical Analysis For Beginners
 Best Indicator For Trading
 Type of Index For Option Treding #pushkar #invest #pranjal #youtubeshorts #ytshorts #shortsvideo
 3 Biggest Mistake Of Options Trading
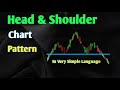 Head & Shoulder Chart Pattern (70% Above Accuracy )
 Mistake Of Traders (90% Trader Do This ) // Part 2
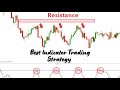 Best Indicator For Trading ( More than 85% Accuracy )
 Best Time For Trading ( 85% Accurate )
 Traders Phycology #tecnicalanalysis #trading #tecnicalanlysis #stockmarket
 DP Charge #pushkar #pranjal #invest #share #harsh #sonu #dr #shortsvideo #youtubeshorts #ytshorts
 Identify Ture Or False Breakout & Breakdown || Tecnical Analysis || Part 16
 Price Action In Simple Language #pushkar #invest #share #pranjal #harsh #sonu #dr
 VWAP Indicator Strategy // Technical Analysis #optionstrading #tradingstrategy #indicators
 Types Of Traders || Systematic vs Aggressive Traders || Part 7
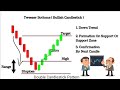 Candlestick Chart Pattern // Tweezer Tops And Tweezer Bottoms
 ATM , OTM , ITM Options || Types of Options || Options Trading
 How To Become A Successful Trader // Road Map For Beginners
 Double Top Chart Pattern #pushkar #pranjal #invest #share #shortsvideo #youtubeshorts #ytshorts