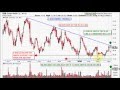
Gaps at the Opening Bell
This lessons describes what causes big gaps on daily charts for stocks, ETF's and the major indexes, and also gives a brief explanation of what a Gap and Trap, and a Gap and Run are.
Learn to trade Like a Pro - Join the StockGoodies Community - It's Free!
Join HERE - http://www.stockgoodies.com
Видео Gaps at the Opening Bell канала StockGoodies Chart-School
Learn to trade Like a Pro - Join the StockGoodies Community - It's Free!
Join HERE - http://www.stockgoodies.com
Видео Gaps at the Opening Bell канала StockGoodies Chart-School
Показать
Комментарии отсутствуют
Информация о видео
31 августа 2013 г. 3:29:12
00:14:12
Другие видео канала
 Support and Resistance
 Candlestick Charts - Part Three - Candlestick Patterns / Combinations
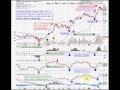 Support and Resistance at the Middle Bollinger Band - Part 2
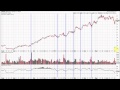 RSI - Relative Strength Index
 MACD - Moving Average Convergence / Divergence
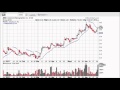 Parabolic SAR
 Chart Patterns - Part One - Introduction
 Candlestick Charts - Part One - Introduction
 Support and Resistance at the Middle Bollinger Band - Part 4
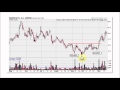 Chart Patterns - Part Two - The Best Bullish and Bearish Patterns
 Stock Chart Setup #1
 Multicollinearity - Choosing Indicators for Best Results
 Support and Resistance at the Middle Bollinger Band - Part 1
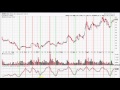 Stochastics
 Moving Averages - Simple and Exponential
 How to Find Good Stocks to Trade
 Buy and Sell Signals - Part 2
 Bollinger Bands
 Stock Chart Setup #2
 SCTR - StockCharts Technical Ranking