327 - An introduction to Single Molecule Fluorescence In Situ Hybridization (smFISH)
327 - An introduction to Single Molecule Fluorescence In Situ Hybridization (smFISH)
smFISH uses a set of short, fluorescently labeled oligonucleotide probes that bind to specific target RNA molecules. Each probe is designed to hybridize to a specific sequence within the target RNA. The probes are designed to be complementary to the target RNA, allowing for specific and precise binding. Upon hybridization, the fluorescent probes generate a signal that can be visualized using fluorescence microscopy.
Why smFISH for studying gene expression?
High sensitivity: smFISH enables the detection of individual RNA molecules, providing high sensitivity and resolution.
Single-cell resolution: It allows the examination of gene expression patterns at the single-cell level, providing insights into cellular heterogeneity.
Quantitative analysis: smFISH enables the quantification of gene expression levels in individual cells or tissues.
Spatial information: It provides spatial localization of RNA molecules within cells, allowing for the investigation of subcellular distribution patterns.
smFISH experimental workflow – at a high level
Sample preparation: Cells or tissues are fixed, permeabilized, and then hybridized with fluorescently labeled probes.
Imaging: The samples are imaged using fluorescence microscopy, capturing the signals emitted by the labeled probes.
Image analysis: The acquired images are processed and analyzed to extract quantitative data on gene expression patterns.
Analyzing smFISH data
Specific analysis approach depends on the research question and the desired insights. However, a general workflow typically involves a few key steps:
Spot and Cluster detection: Detect individual spots or clusters corresponding to the bound fluorescent probes.
Cellular and nuclear segmentation: crucial for assigning spots to specific cellular compartments and extracting cell-specific information.
Statistical analysis: such as average distance of mRNA spots from the cell boundary, proportion of mRNA spots within the nucleus versus the cytoplasm. Note that multiplex analysis involves additional steps such as colocalization
Visualization and interpretation: heatmaps or scatter plots to interpret the analyzed data effectively.
Видео 327 - An introduction to Single Molecule Fluorescence In Situ Hybridization (smFISH) канала DigitalSreeni
Показать
Комментарии отсутствуют
Информация о видео
Другие видео канала
 Exploring Metadata in Scientific Images
 A Holistic View of Software Languages, Databases, and Frameworks
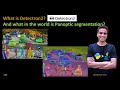 329 - What is Detectron2? An introduction.
 Interpolation for resizing 3D volumetric data (Tips and Tricks 50)
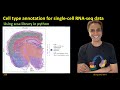 326 - Cell type annotation for single cell RNA seq data
 325: Transcriptomics Unveiled – An In-Depth Exploration of Single Cell RNASeq Analysis using python
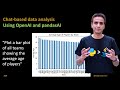 324 - Chat-based data analysis using openAI and pandasAI
 323 - How to train a chatbot on your own documents?
 311 - Fine tuning GPT2 using custom documents
 Overlaying images for easy comparison (in python)
 310 - Understanding sub word tokenization used for NLP
 307 - Segment your images in python without training using Segment Anything Model (SAM)
 Feature engineering vs Feature Learning (tips tricks 46 )
 Camouflage simulation using the Genetic Algorithm
 White balancing your pictures using python
 291 - Object segmentation using Deep Learning based edge detection (HED)
 290 - Deep Learning based edge detection using HED
 What are various underscores used in python?
 285 - Object detection using Mask RCNN (with XML annotated data)
 23b - Image segmentation using color spaces - in python