2D - Plotting Scalar and Vector Fields with Python
Tutorial on how to plot using Python's Matplotlib library in Jupyter Notebook
- Anaconda environment
- 2D/3D line plots
- 2D/3D surface plots
- 2D Contour plots
- 2D/3D vector fields
ECE 4800 Fall 2020
Electromagnetic Fields and Waves
Wayne State University
Prof. Amar Basu
Видео 2D - Plotting Scalar and Vector Fields with Python канала Microfluidics and BioInstrumentation Lab @ Wayne State University
Показать
Комментарии отсутствуют
Информация о видео
6 февраля 2020 г. 0:33:11
01:38:24
Другие видео канала
 Python Pop: Plotting 3D Vectors
 2nd Year Calculus, But in PYTHON
 Divergence and curl: The language of Maxwell's equations, fluid flow, and more
 Vector fields, introduction | Multivariable calculus | Khan Academy
 Professional 3D Plotting in Matplotlib
 Game Development Tutorial | Cellular Automata and Procedural Map Generation
 Machine Learning for Fluid Dynamics: Patterns
 You MUST WATCH THIS before installing PYTHON. PLEASE DON'T MAKE this MISTAKE.
 Making Vector Plots in Python using Quiver (ChEn 374 - Supplement to Lecture 14)
 Building a Simple Climate Model
 Support Vector Machine (SVM) in 7 minutes - Fun Machine Learning
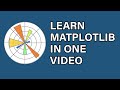 Matplotlib Tutorial 2021
 Python Create Interactive Charts and Maps with Bokeh
 Einsum Is All You Need: NumPy, PyTorch and TensorFlow
 Electric and Magnetic Fields - 1. Point Charges
 Creating particle effects in pygame
 Visualizing Vector Fields
 Python - Matplotlib Tutorial for Beginners
 Java: Read a CSV File into an Array
 Calculus 3 Lecture 15.1: INTRODUCTION to Vector Fields (and what makes them Conservative)