#325: Use NanoVNA and Smith Chart to show effect of adding transmission line length
This video shows how adding or removing transmission line (coax) between a transmitter and an antenna affects the SWR and impedance looking into the line. The Smith Chart is used to show how to graphically visualize the result, and then the NanoVNA is used to demonstrate these effects on a real antenna and feedline. Please refer to other videos in my NanoVNA playlist to learn how to setup, calibrate and operate the NanoVNA. Here is a link to my NanoVNA video playlist:
https://www.youtube.com/playlist?list=PL4ZSD4omd_AylEyNCQYR3RcEb0olukPEJ
Here is a link to the notes from this video:
http://www.qsl.net/w2aew/youtube/EffectofAddingRemovingCoax.pdf
Видео #325: Use NanoVNA and Smith Chart to show effect of adding transmission line length канала w2aew
https://www.youtube.com/playlist?list=PL4ZSD4omd_AylEyNCQYR3RcEb0olukPEJ
Here is a link to the notes from this video:
http://www.qsl.net/w2aew/youtube/EffectofAddingRemovingCoax.pdf
Видео #325: Use NanoVNA and Smith Chart to show effect of adding transmission line length канала w2aew
Показать
Комментарии отсутствуют
Информация о видео
Другие видео канала
 #314: How to use the NanoVNA to sweep / measure an antenna system's SWR and optimize its tuning
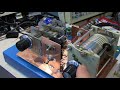 #274: Smith Chart Basics: Impedance and Admittance curves and conversion
 #297: Basics of the Smith Chart - Intro, impedance, VSWR, transmission lines, matching
 #316: Use NanoVNA to measure coax length - BONUS Transmission Lines and Smith Charts, SWR and more

 #600b Replacement TinySA Has Arrived! Let's Check it Out
 Using a nanoVNA & SimSmith to solve an antenna matching problem
 RF Man Discusses Self Resonant Frequency of Capacitors and Inductors
 Using a nanoVNA to determine unknown inductance value
 #191 Optimizing Antennas using a cheap N1201SA VNA (Vector Impedance Analyzer), LoRa, Review
 #359 How to properly use a NanoVNA V2 Vector Network Analyzer & Smith Chart (Tutorial)
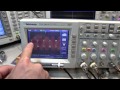 #208: Visualizing RF Standing Waves on Transmission Lines
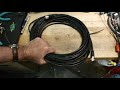 #564 NANOVNA Coax Loss Measurement
 NanoVNA - Measuring RLC Components
 #318: NanoVNA comparison measuring a duplexer - NanoVNA-H4 and SAA-2N
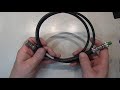 #326: How to Measure the impedance of "unknown" coax using a NanoVNA
 What capacitor goes on the transformer?!
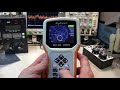 #280: Review of RigExpert AA-55 ZOOM Antenna and Cable Analyzer
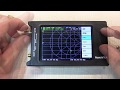 #313: Why a VNA needs to be calibrated | how to calibrate a nanoVNA