6 Must have line charts for business data analysis 📈👌
Line charts are a staple in data analysis. But do you know these 6 variations to them? Use these line chart options to analyze and present business data in different ways.
Charts covered in this video:
Regular line chart
1. Indexed chart for comparing trends
2. Sparkline for tiny insights
3. Spaghetti line chart for bringing focus on a specific series
4. Smoothed line chart for evening out edges
5. Forecast chart to predict future values based on trend and seasonality
6. Line chart combinations when just a line won't do
* Bonus trick - special data labels on line charts
For example file with all the charts:
============================
Visit https://chandoo.org/wp/line-chart-variations/
More on Line charts & data visualization:
Forecasting in Excel - https://youtu.be/MIzy-aCYG_I
Adding line to column charts - https://youtu.be/3xh19tLx8Do
#MsExcel #Dataviz
Видео 6 Must have line charts for business data analysis 📈👌 канала Chandoo
Показать
Комментарии отсутствуют
Информация о видео
Другие видео канала
 Power Query Tutorial - What is it, how to use it & 4 complete examples + Free download
 Bill Jelen - MrExcel's Best Excel Tips (including a secret tip from FBI 😮)
 The *ONLY* 10 Excel keyboard shortcuts you need to master
 5 Simple step to make amazing excel charts (works every time)
 Google Sheets Tutorial in Hindi | Everyone should Learn What is use of Googlesheets
 How to make variance chart in Power BI to measure performance
 How to make a sexy interactive chart slider thingy in Excel?
 Drop Down Lists in Excel - Masterclass (incl. Dynamic, Dependent & Searchable Drop Down Lists)
 10 Excel formatting tricks *ONLY* experts know
 Google Sheets - 5 Reason To Use Google Sheets
 6 FREE Add-Ins for Excel to Start Using Now
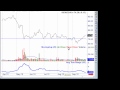 Learn to Read Line Charts and Identify Patterns
 VLOOKUP or INDEX+MATCH? Excel Interview Question - 01
 Top 10 Excel Formulas - for any situation
 5 WEIRD & CRAZY Excel formulas - FILTERXML, BASE, REPT and more...
 Two-level data validation in Excel - Simple trick
 Advanced Pivot Table Tricks #5 - Two Tables, One Pivot
 How to easily automate boring Excel tasks with Power Query!
 Data validation without duplicates - Excel Tricks
 10 awesome things you can do in Excel - WITHOUT any formulas or pivots