- Популярные видео
- Авто
- Видео-блоги
- ДТП, аварии
- Для маленьких
- Еда, напитки
- Животные
- Закон и право
- Знаменитости
- Игры
- Искусство
- Комедии
- Красота, мода
- Кулинария, рецепты
- Люди
- Мото
- Музыка
- Мультфильмы
- Наука, технологии
- Новости
- Образование
- Политика
- Праздники
- Приколы
- Природа
- Происшествия
- Путешествия
- Развлечения
- Ржач
- Семья
- Сериалы
- Спорт
- Стиль жизни
- ТВ передачи
- Танцы
- Технологии
- Товары
- Ужасы
- Фильмы
- Шоу-бизнес
- Юмор
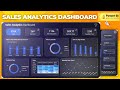
Power BI Report View Explained (Beginner Guide 2025) DAY-46 #datamindsacademy
The Report View is where your Power BI dashboards come to life. In this video, you’ll learn Introduction to Power BI Report View and understand how to start building your first interactive report.
We’ll explore the Report View interface step by step, including the canvas, visualizations pane, fields pane, and formatting options. You’ll see how to add visuals, arrange them on the canvas, and start creating meaningful insights from your data.
Understanding Introduction to Power BI Report View is important because this is where all your data modeling and DAX work gets transformed into visual dashboards. A well-structured report improves usability and helps users understand insights quickly.
This topic connects directly with earlier lessons on data modeling, relationships, and DAX measures. It also prepares you for upcoming topics like creating charts, formatting visuals, adding filters, and designing professional dashboards.
This tutorial is part of the Power BI Beginner to Advanced series on DataMinds Academy, designed to help beginners and intermediate learners build complete Power BI solutions.
👉 If you find this video helpful, like the video, subscribe to DataMinds Academy, and comment what type of report you want to build next.
#PowerBI
#PowerBIReport
#PowerBITutorial
#DataMindsAcademy
#BusinessIntelligence
#DataVisualization
Видео Power BI Report View Explained (Beginner Guide 2025) DAY-46 #datamindsacademy канала DataMinds Academy
Комментарии отсутствуют
Информация о видео
18 марта 2026 г. 20:30:30
00:06:37
Другие видео канала