- Популярные видео
- Авто
- Видео-блоги
- ДТП, аварии
- Для маленьких
- Еда, напитки
- Животные
- Закон и право
- Знаменитости
- Игры
- Искусство
- Комедии
- Красота, мода
- Кулинария, рецепты
- Люди
- Мото
- Музыка
- Мультфильмы
- Наука, технологии
- Новости
- Образование
- Политика
- Праздники
- Приколы
- Природа
- Происшествия
- Путешествия
- Развлечения
- Ржач
- Семья
- Сериалы
- Спорт
- Стиль жизни
- ТВ передачи
- Танцы
- Технологии
- Товары
- Ужасы
- Фильмы
- Шоу-бизнес
- Юмор
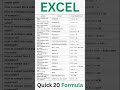
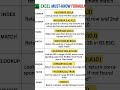
Excel Line Chart in 1 Min #shorts #ytshorts #charts #datavisualization #stockmarket
Excel Line Chart in 1 Min Learn how to insert a Stacked Line Chart with Markers in Excel in just 1 minute. Line charts are one of the most effective ways to visualize trends in sales, research, and education. In this quick Excel tutorial, we cover how to create both a basic Line Chart and a Stacked Line Chart with Markers step by step. This video is part of our 1-minute Excel series designed to help you learn fast and apply instantly. If you find this helpful, please like the video, subscribe to our channel, and leave a comment below. Your support helps us keep creating quick, useful tutorials. We also offer free tutorials and certification on data analytics tools like Excel, Power BI, and Tableau. Don’t forget to subscribe and turn on the notification bell to stay updated.
#ExcelTips #LineChart #ExcelTutorial #DataAnalytics #ExcelShorts #PowerBI #Tableau #FreeCourses #StackedLineChart
Видео Excel Line Chart in 1 Min #shorts #ytshorts #charts #datavisualization #stockmarket канала Discover Talent™
#ExcelTips #LineChart #ExcelTutorial #DataAnalytics #ExcelShorts #PowerBI #Tableau #FreeCourses #StackedLineChart
Видео Excel Line Chart in 1 Min #shorts #ytshorts #charts #datavisualization #stockmarket канала Discover Talent™
insert line chart in excel excel chart tutorial stacked line chart excel data visualization excel line chart with markers 1 minute excel tutorial excel chart guide Excel Line Chart in 1 Min excel chart excel line chart excel chart with markers excel training line chart in excel excel dashboard excel tricks excel analytics excel short video excel charts tutorial learn excel fast excel marker chart power bi tableau free excel course excel how to `` fyp
Комментарии отсутствуют
Информация о видео
4 мая 2025 г. 19:56:54
00:00:57
Другие видео канала