HR Diversity Scorecard
Chantilly Jaggernauth, a Tableau Zen Master, shares her methods for creating this insightful dashboard in Tableau in the “HR Diversity Scorecard: Understanding Your Numbers” webinar!
By the end of this session, attendees will understand how Chantilly uses sample HR data in Tableau to help organizations track better track their diversity data.
Agenda:
Importance of understanding your organization's diversity numbers
Overview of the dashboard
Overview of the data
Deep dive of the technical aspects / calcs
Bringing it all together using design principles
Видео HR Diversity Scorecard канала Lovelytics
Показать
Комментарии отсутствуют
Информация о видео
Другие видео канала
 Design Secrets - Modern Investment Dashboard & Embedding
 Power BI Tutorial From Beginner to Pro ⚡ Desktop to Dashboard in 60 Minutes ⏰
 Lovelytics Alteryx Virtual Training
 How to build Interactive Excel Dashboards that Update with ONE CLICK!
 Don't Put People in Boxes
 Interactive Excel HR Dashboard - FREE Download
 Contain(er) Your Excitement: Dashboard Tips
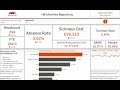 HR Analytics in Tableau
 Secrets to Building Excel Dashboards in Under 15 Minutes!
 The IF, THEN, ELSE, ELSEIF, IFNULL, IIF, AND & OR functions in Tableau
 Dashboard Creation in Ibm Cognos Analytics 11.0 Part-01
 Mini Tableau Tutorial: Donut Chart
 On Diversity: Access Ain’t Inclusion | Anthony Jack | TEDxCambridge
 Tableau Dashboard for Organizational Human Resource Diversity Metrics and Charts
 Human Resource (HR) Analytics in POWER BI - Dashboard - Part 1
 Tips and Tricks from a Tableau Jedi
![Tableau Group vs Set [What's the Difference between Tableau's Sets and Groups?]](https://i.ytimg.com/vi/a35QPlHyofY/default.jpg) Tableau Group vs Set [What's the Difference between Tableau's Sets and Groups?]
Tableau Group vs Set [What's the Difference between Tableau's Sets and Groups?] Create interactive resume in 1 hour using Tableau public
 Radial Bar charts in Tableau using Table Calculations
 Donut Chart in Tableau