- Популярные видео
- Авто
- Видео-блоги
- ДТП, аварии
- Для маленьких
- Еда, напитки
- Животные
- Закон и право
- Знаменитости
- Игры
- Искусство
- Комедии
- Красота, мода
- Кулинария, рецепты
- Люди
- Мото
- Музыка
- Мультфильмы
- Наука, технологии
- Новости
- Образование
- Политика
- Праздники
- Приколы
- Природа
- Происшествия
- Путешествия
- Развлечения
- Ржач
- Семья
- Сериалы
- Спорт
- Стиль жизни
- ТВ передачи
- Танцы
- Технологии
- Товары
- Ужасы
- Фильмы
- Шоу-бизнес
- Юмор
Hammer Pattern is Misunderstood (Here’s Why)
The Hammer candlestick pattern is one of the most important bullish reversal patterns in technical analysis. It usually appears after a downtrend and signals that selling pressure may be weakening while buyers begin to step in.
In this quick 1-minute candlestick trading guide, you will learn:
• What a Hammer candlestick looks like
• Why it signals selling pressure weakening
• How buyers regain control after a decline
• How traders use the pattern to anticipate trend reversals
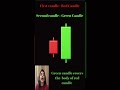
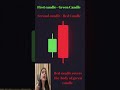
A Hammer typically forms when sellers push prices lower during the candle, but strong buying pressure drives the price back up before the candle closes.
This creates a candlestick with:
• A small body near the top
• A long lower shadow
• Very little or no upper wick
The long lower wick shows that the market rejected lower prices, which can sometimes indicate the start of a bullish reversal. However, most traders wait for confirmation from the next candle before taking a trade.
Understanding candlestick patterns like the Hammer helps traders interpret price action, market psychology, and potential reversals more effectively.
Open your XTB trading account here:
https://geolink.xtb.com/pjWWm
⚠️ Risk Disclaimer:
Trading and investing in financial markets involves risk and may not be suitable for all investors. This content is strictly for educational and informational purposes only and should not be considered financial or investment advice.
#HammerCandlestick #CandlestickPattern #PriceAction #TechnicalAnalysis #TradingForBeginners #StockMarket #TradingEducation
Видео Hammer Pattern is Misunderstood (Here’s Why) канала Matrix Ai India
In this quick 1-minute candlestick trading guide, you will learn:
• What a Hammer candlestick looks like
• Why it signals selling pressure weakening
• How buyers regain control after a decline
• How traders use the pattern to anticipate trend reversals
A Hammer typically forms when sellers push prices lower during the candle, but strong buying pressure drives the price back up before the candle closes.
This creates a candlestick with:
• A small body near the top
• A long lower shadow
• Very little or no upper wick
The long lower wick shows that the market rejected lower prices, which can sometimes indicate the start of a bullish reversal. However, most traders wait for confirmation from the next candle before taking a trade.
Understanding candlestick patterns like the Hammer helps traders interpret price action, market psychology, and potential reversals more effectively.
Open your XTB trading account here:
https://geolink.xtb.com/pjWWm
⚠️ Risk Disclaimer:
Trading and investing in financial markets involves risk and may not be suitable for all investors. This content is strictly for educational and informational purposes only and should not be considered financial or investment advice.
#HammerCandlestick #CandlestickPattern #PriceAction #TechnicalAnalysis #TradingForBeginners #StockMarket #TradingEducation
Видео Hammer Pattern is Misunderstood (Here’s Why) канала Matrix Ai India
hammer candlestick hammer candlestick pattern hammer pattern trading bullish reversal candlestick bullish reversal pattern candlestick patterns candlestick trading price action trading technical analysis trading hammer candlestick explained hammer candlestick for beginners trading candlestick patterns stock market trading stock market for beginners price action technical analysis
Комментарии отсутствуют
Информация о видео
15 апреля 2026 г. 19:01:32
00:01:07
Другие видео канала