How to in Tableau in 5 mins: Standard Deviation in the Analytics Pane
Learn how to use Tableau's calculation functions and create standard calculations in Tableau. In this video learn how you can calculate Standard Deviation using the Analytics Pane with Valerie Madojemu.
Links
- Follow Valerie on twitter: https://twitter.com/Mad4Viz
- Connect with Valerie on LinkedIn: https://www.linkedin.com/in/valerie-madojemu-5bb697108/
- Find out more about the Analytics Pane in Tableau: https://help.tableau.com/current/pro/desktop/en-us/environ_workspace_analytics_pane.htm
- How to build Control Chart - https://www.youtube.com/watch?v=0JdMsUIGflg
- Table calculations Overview - https://www.youtube.com/watch?v=XPYtenDXCdI
- Alex Hurst: Making things dynamic & colour formatting https://www.youtube.com/watch?v=4iSOHHiL4hI
----------------------------------------------------------------------------------------------------
Want more information about us? Head over to theinformationlab.co.uk
Want to see more of our events? Head over to til.bi/talkdata to find out more
----------------------------------------------------------------------------------------------------
Видео How to in Tableau in 5 mins: Standard Deviation in the Analytics Pane канала The Information Lab
Показать
Комментарии отсутствуют
Информация о видео
Другие видео канала
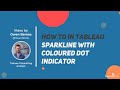 How to in Tableau in 5 mins: Create Sparkline with Coloured Indicator
 Understanding AWS CLI Configuration
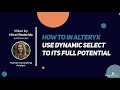 How to in Alteryx in 5 mins: Use the Dynamic Select Tool
 Live Stream – Pass Go, Faster with Alteryx
 How to in Tableau Prep in 5 mins: Group & Replace
 How to in Tableau Prep in 5 mins: Investigate Errors
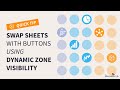 Switch Between Multiple Charts Using Buttons With Dynamic Zone Visibility
 You put one set value in, you take one set value out, in, out, in, out and viz it all about
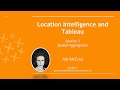 Location Intelligence (2) - Aggregation: where and how many?
 Watch Me Viz - Chris Love - Iron Viz - Part 1
 Behind the Viz: The Inequality Pandemic by Diego Parker
 Do good with Data: 5 Questions with Viz for Social Good
 Session 1: The Essentials of “where”
 How to in Tableau in 5 mins: Create a Rounded Edge Bar Chart
 AWS: Infrastructure as Code for Tableau Server
 How to in Tableau in 5 mins: Create Dynamically Coloured BANs
 How to in Tableau Prep in 5 mins: Filter with a Join
 Data School New York: Mar 16 Meet and Greet Application Tips
 Data School New York: Feb 16 Meet the Coaches Tableau Build-a-Long with Andy Kriebel
 Know Before You Go: DataDev Edition
 How to in Tableau in 5 mins: Structure your Data for a Visual Resume