R tutorial: Descriptive statistics (base R and "tableone")
This video shows you how to produce descriptive statistics using base R as well as the tableone package. It covers labelling variables as categorical, producing descriptives for separate groups and p values for group differences.
Data and code used can be found here https://drive.google.com/drive/folders/1fAzP3DQBtcnKVRrdrqvFzzh7wvNGrSHz?usp=sharing
Видео R tutorial: Descriptive statistics (base R and "tableone") канала Statistics Guides with Dr Paul Christiansen
Data and code used can be found here https://drive.google.com/drive/folders/1fAzP3DQBtcnKVRrdrqvFzzh7wvNGrSHz?usp=sharing
Видео R tutorial: Descriptive statistics (base R and "tableone") канала Statistics Guides with Dr Paul Christiansen
Показать
Комментарии отсутствуют
Информация о видео
1 декабря 2020 г. 22:23:00
00:13:40
Другие видео канала
 Create Table 1 using R: Output Excel, MS Word Tables
 Descriptive Statistics in R
 Breusch–Pagan test to Check Heteroscedasticity in R || Linear Regression || Econometrics
 Exploratory Analysis in R Studio| Summary Statistics | Descriptive Analysis
 Chi-Squared Testing for Independence in R
 Data Type Conversion in R (2 Examples) | Convert Character & Factor to Numeric Class
 Quick lesson: How to make tables in MS Word from your data in R
 DESCRIPTIVE STATISTICS R SOFTWARE
 Important Base R Functions | R Tutorial (2020)
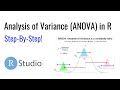 Analysis of Variance (ANOVA) in R
 LOGIT REGRESSION IN R: ODDS RATIO INTERPRETATIONS!!! #1.4
 Recoding data using R programming. Using the tidyverse and dplyr packages to create a new variable
 R Programming Tutorial - Learn the Basics of Statistical Computing
 use ifelse() function in R to create dummy variables and categorical variables
 Summary Statistics with One Variable - R for Economists Basics 8
 R programming for beginners – statistic with R (t-test and linear regression) and dplyr and ggplot
 R tutorial: Creating Maps and mapping data with ggplot2
 Dummy Variables or Indicator Variables in R | R Tutorial 5.5 | MarinStatsLectures
 10. Descriptive Statistics with the psych Package in R
 RStudio (6): Descriptive Statistics and Frequency Table in R