- Популярные видео
- Авто
- Видео-блоги
- ДТП, аварии
- Для маленьких
- Еда, напитки
- Животные
- Закон и право
- Знаменитости
- Игры
- Искусство
- Комедии
- Красота, мода
- Кулинария, рецепты
- Люди
- Мото
- Музыка
- Мультфильмы
- Наука, технологии
- Новости
- Образование
- Политика
- Праздники
- Приколы
- Природа
- Происшествия
- Путешествия
- Развлечения
- Ржач
- Семья
- Сериалы
- Спорт
- Стиль жизни
- ТВ передачи
- Танцы
- Технологии
- Товары
- Ужасы
- Фильмы
- Шоу-бизнес
- Юмор
Firebolt Monitor Tool setup | Setting up the Query History dashboard
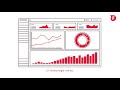
How to set up the Firebolt Query History Dashboard:
In order to monitor query performance within Firebolt effectively, it is convenient to have this data made available via a dashboard. In order to set up a monitoring dashboard, we have provided a means to connect to Firebolt via Grafana and a sample dashboard that can be used to perform monitoring of the system using the information_schema.query_history and information_schema.running_queries tables. Use this video along with the help article available in the Firebolt Help Center:
https://help.firebolt.io/t/how-to-set-up-the-firebolt-query-history-dashboard/132
Видео Firebolt Monitor Tool setup | Setting up the Query History dashboard канала Firebolt
Комментарии отсутствуют
Информация о видео
19 декабря 2022 г. 18:47:41
00:12:55
Другие видео канала