How to Avoid P Hacking
“There are three kinds of lies: Lies, Damned Lies and Statistics,” Benjamin Disraeli. Much of this distrust around statisticians has to do with p-hacking. A p-hacker is someone who violates the rules of statistics by influencing the data collection process or statiscal analyses performed, in order to produce a statistically significant result.
Subscribe to advance your knowledge of statistics and data visualization:
Click here- https://www.youtube.com/GraphPadSoftware?su…
Recommended Playlist – Statistics Bootcamp
https://youtube.com/playlist?list=PL1ZBP3I7BPqkycsx_xkCYLCVZuDEUgYX8
Timestamps
- 00:00
- 1:10 - Tip 1 Establish hypothesis and sample size before data collection
- 1:18 - Tip 2 Avoid multiple tests on the same data set over time
- 1:24 - Tip 3 Accounting for number of comparisons
- 1:31 - Tip 4 Don’t choose a subset of data to analyse after observing the results
- 1:35 - Tip 5 Don’t eliminate outliers without identifying a special cause
- 1:40 Tip 6 Don’t change the alt. Hypothesis to match the direction of the results observed
- 1:45 Tip 7 Don’t choose a less appropriate analysis because the p-value shows you the result you want
-1:52 P-Hacking in the real world
About the video
Join Jim Colton, M.S., Statistics and the Lead Statistician at Graphpad, as explores the importance of this topic. P-hacking is significant for all researchers because the statistical results can only be interpreted at face value, when every choice in data analysis was performed exactly as planned and documented as part of the experimental design.
In this video you will learn:
- What P-hacking is and why it’s important
- Seven steps for avoiding P-hacking
- How P-hacking can occur (real-world example)
FREE USEFUL TOOLS FOR RESEARCHERS
QuickCalcs
Run quick statistical tests with free online calculators.
https://www.graphpad.com/data-analysis-resource-center/#quickcalcs
How to perform the most common types of analyses
Learn the steps required to perform the most common types of analyses. Topics include selecting the right data table, navigating the analysis choices and results, and formatting and annotating your graphs.
https://www.graphpad.com/series/essential-statistics/
Free Statistics Bootcamp
Without an understanding of the fundamentals of statistics, it can be intimidating. This video series gives you the statistical background you need to start performing analyses in Prism with confidence.
https://www.graphpad.com/series/statistics-bootcamp/
Create High-Quality Graphs for your Research
Learn how to tell the story you want with your data!
https://www.graphpad.com/series/graphing-basics/
www.graphpad.com/prism
Видео How to Avoid P Hacking канала GraphPad Software
Показать
Комментарии отсутствуют
Информация о видео
Другие видео канала
 How to Avoid Common Data Visualization Mistakes Part 2: Unequally Spaced Tick Marks
 How to Choose Between a Paired and Unpaired T Test
 How to Avoid P Hacking
 Differences Between Regression and Correlation
 Quick Tips: Results Tab in Prism
 Understanding Different Types of Data
 Estimation Plots and Stars on a Graph
 How to Perform Descriptive Statistics in Prism
 How to Choose Between Parametric & Nonparametric Analysis
 How to Choose Between a Paired and Unpaired T Test
 Understanding the Different Types of Data
 How to Perform a Two Sample T-Test
 How to Establish Cause and Effect
 New options for two-way ANOVA multiple comparisons
 How to Avoid Common Data Visualization Mistakes Part 6: Error Bars Not Explained
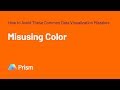 How to Avoid Common Data Visualization Mistakes Part 7: Misusing Color
 Prism 10: A Quick Glance
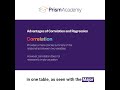 Advantages of Regression and Correlation
 How to Use Correlation
 A more open file format