- Популярные видео
- Авто
- Видео-блоги
- ДТП, аварии
- Для маленьких
- Еда, напитки
- Животные
- Закон и право
- Знаменитости
- Игры
- Искусство
- Комедии
- Красота, мода
- Кулинария, рецепты
- Люди
- Мото
- Музыка
- Мультфильмы
- Наука, технологии
- Новости
- Образование
- Политика
- Праздники
- Приколы
- Природа
- Происшествия
- Путешествия
- Развлечения
- Ржач
- Семья
- Сериалы
- Спорт
- Стиль жизни
- ТВ передачи
- Танцы
- Технологии
- Товары
- Ужасы
- Фильмы
- Шоу-бизнес
- Юмор
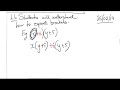
How to Plot a Graph on Excel
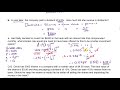
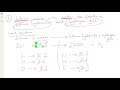
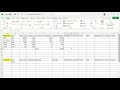
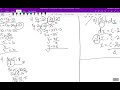
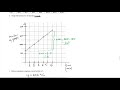
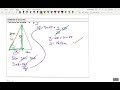
Learning Goal: Students will understand how to plot a line graph in excel for a grade 10 chemistry class. They investigated the rate of a reaction by increasing the temperature and measuring the time taken for an antacid to dissolve.
They will be able to use statistics to include uncertainty which will highlight the reliability if the data.
Видео How to Plot a Graph on Excel канала Mr JTeach
They will be able to use statistics to include uncertainty which will highlight the reliability if the data.
Видео How to Plot a Graph on Excel канала Mr JTeach
Комментарии отсутствуют
Информация о видео
6 сентября 2019 г. 5:02:20
00:14:08
Другие видео канала